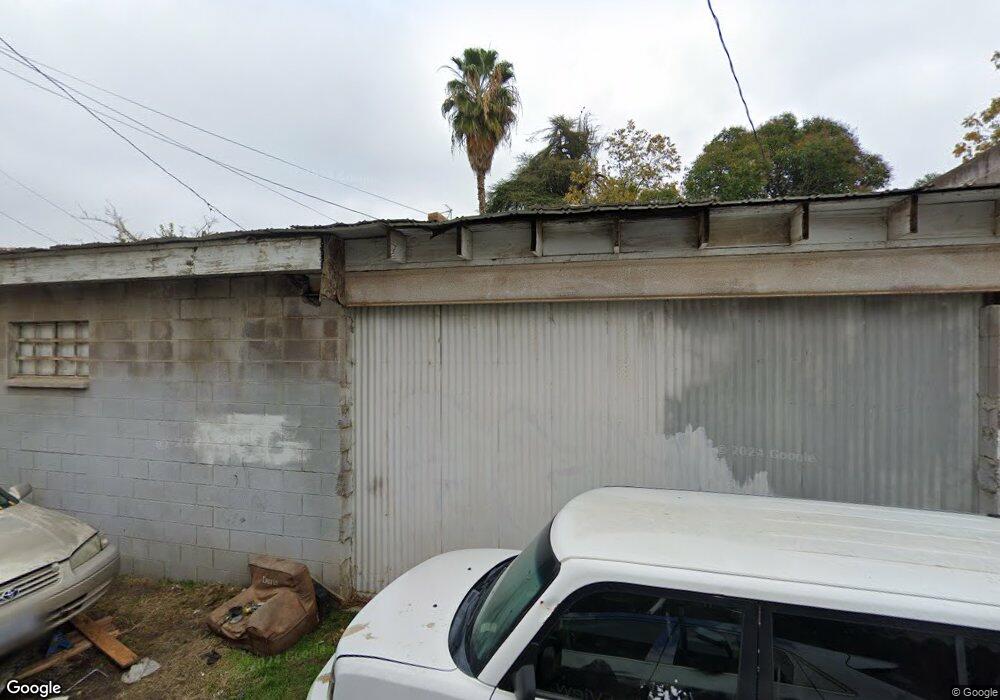
235 N I St Tulare, CA 93274
Estimated Value: $217,231 - $291,000
2
Beds
2
Baths
1,623
Sq Ft
$159/Sq Ft
Est. Value
About This Home
This home is located at 235 N I St, Tulare, CA 93274 and is currently estimated at $258,808, approximately $159 per square foot. 235 N I St is a home located in Tulare County with nearby schools including Maple Elementary School, Los Tules Middle School, and Tulare Western High School.
Ownership History
Date
Name
Owned For
Owner Type
Purchase Details
Closed on
Oct 27, 2001
Sold by
Doria Concepcion
Bought by
Doria Concepcion
Current Estimated Value
Home Financials for this Owner
Home Financials are based on the most recent Mortgage that was taken out on this home.
Original Mortgage
$23,359
Interest Rate
6.84%
Mortgage Type
Stand Alone Second
Purchase Details
Closed on
Mar 30, 1999
Sold by
Rasmussen Darryl
Bought by
Martinez Concepcion C
Home Financials for this Owner
Home Financials are based on the most recent Mortgage that was taken out on this home.
Original Mortgage
$53,885
Interest Rate
6.84%
Mortgage Type
FHA
Create a Home Valuation Report for This Property
The Home Valuation Report is an in-depth analysis detailing your home's value as well as a comparison with similar homes in the area
Home Values in the Area
Average Home Value in this Area
Purchase History
| Date | Buyer | Sale Price | Title Company |
|---|---|---|---|
| Doria Concepcion | -- | Fidelity National Title | |
| Martinez Concepcion C | $54,000 | Fidelity National Title Co |
Source: Public Records
Mortgage History
| Date | Status | Borrower | Loan Amount |
|---|---|---|---|
| Closed | Doria Concepcion | $23,359 | |
| Previous Owner | Martinez Concepcion C | $53,885 |
Source: Public Records
Tax History Compared to Growth
Tax History
| Year | Tax Paid | Tax Assessment Tax Assessment Total Assessment is a certain percentage of the fair market value that is determined by local assessors to be the total taxable value of land and additions on the property. | Land | Improvement |
|---|---|---|---|---|
| 2025 | $921 | $84,656 | $26,648 | $58,008 |
| 2024 | $921 | $82,997 | $26,126 | $56,871 |
| 2023 | $898 | $81,370 | $25,614 | $55,756 |
| 2022 | $872 | $79,775 | $25,112 | $54,663 |
| 2021 | $861 | $78,211 | $24,620 | $53,591 |
| 2020 | $875 | $77,409 | $24,368 | $53,041 |
| 2019 | $897 | $75,891 | $23,890 | $52,001 |
| 2018 | $883 | $74,403 | $23,422 | $50,981 |
| 2017 | $874 | $72,944 | $22,963 | $49,981 |
| 2016 | $836 | $71,514 | $22,513 | $49,001 |
| 2015 | $761 | $70,440 | $22,175 | $48,265 |
| 2014 | $761 | $65,000 | $16,000 | $49,000 |
Source: Public Records
Map
Nearby Homes