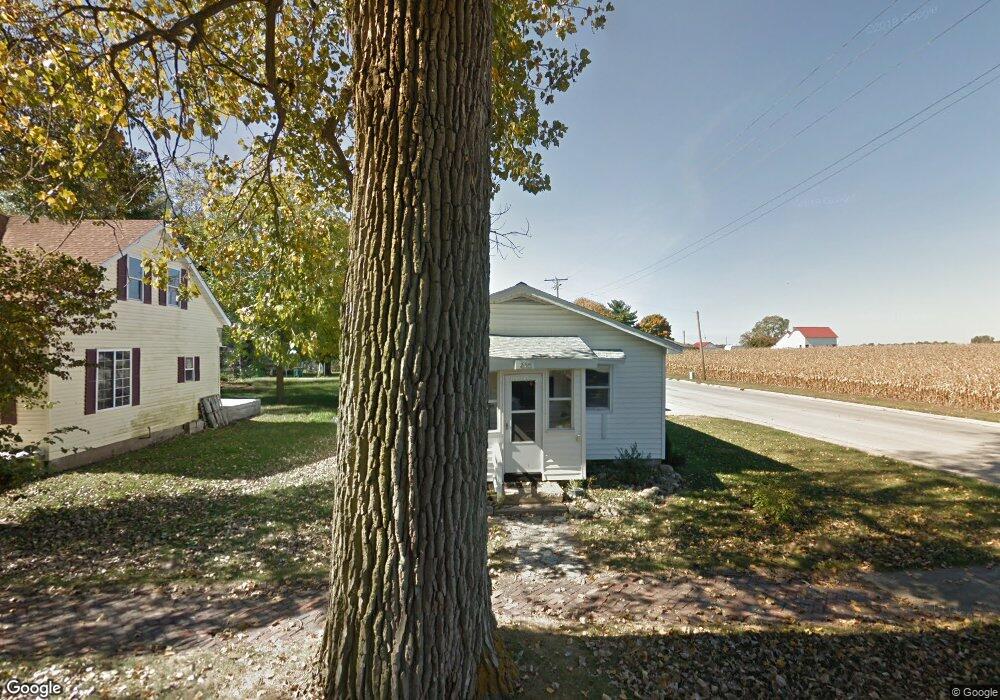
235 N Patterson St Lovington, IL 61937
Estimated Value: $56,496 - $106,000
1
Bed
1
Bath
816
Sq Ft
$98/Sq Ft
Est. Value
About This Home
This home is located at 235 N Patterson St, Lovington, IL 61937 and is currently estimated at $79,624, approximately $97 per square foot. 235 N Patterson St is a home located in Moultrie County with nearby schools including Lovington Grade School and Arthur Lovington Atwood Hammond High School.
Ownership History
Date
Name
Owned For
Owner Type
Purchase Details
Closed on
Jul 23, 2021
Sold by
Jones Matt
Bought by
Light Scott
Current Estimated Value
Purchase Details
Closed on
Aug 13, 2020
Sold by
Ozier Gary and Ozier Mary
Bought by
Jones Matt and Light Scott
Purchase Details
Closed on
Jun 27, 2011
Sold by
Mccomas Dorothy E and Lee James D
Bought by
Ozier Gary and Ozier Mary
Create a Home Valuation Report for This Property
The Home Valuation Report is an in-depth analysis detailing your home's value as well as a comparison with similar homes in the area
Home Values in the Area
Average Home Value in this Area
Purchase History
| Date | Buyer | Sale Price | Title Company |
|---|---|---|---|
| Light Scott | -- | None Available | |
| Jones Matt | $50,000 | None Available | |
| Ozier Gary | $20,000 | None Available |
Source: Public Records
Tax History Compared to Growth
Tax History
| Year | Tax Paid | Tax Assessment Tax Assessment Total Assessment is a certain percentage of the fair market value that is determined by local assessors to be the total taxable value of land and additions on the property. | Land | Improvement |
|---|---|---|---|---|
| 2024 | $549 | $13,579 | $1,358 | $12,221 |
| 2023 | $503 | $12,749 | $1,275 | $11,474 |
| 2022 | $326 | $10,471 | $1,805 | $8,666 |
| 2021 | $313 | $9,955 | $1,716 | $8,239 |
| 2020 | $290 | $9,559 | $1,648 | $7,911 |
| 2019 | $276 | $9,391 | $1,619 | $7,772 |
| 2018 | $292 | $9,613 | $1,175 | $8,438 |
| 2017 | $290 | $9,575 | $1,170 | $8,405 |
| 2016 | $298 | $9,597 | $1,173 | $8,424 |
| 2015 | $283 | $9,410 | $1,150 | $8,260 |
| 2014 | -- | $9,230 | $1,160 | $8,070 |
| 2013 | -- | $9,230 | $1,160 | $8,070 |
Source: Public Records
Map
Nearby Homes
- 426 W Springfield Rd
- 226 S Noah St
- 14 E Okaw Estates
- 670 County Rd 1875 N
- 507 S C St
- 453 Cr 1750n
- 746 Cr 1500n
- 114 E North St
- 204 N East B St
- 11 Iola Ct
- 235 E 150 Rd N
- 207 N Washington St
- 312 W North Water St
- 320 S Saint John St
- 215 W Mitchell St
- 1 Elm Dr
- 601 W South St
- 9 Elm Dr
- 265B Illinois 121
- 716 W Robinson St
- 227 N Patterson St
- 221 N Patterson St
- 621 W Springfield Rd
- 236 N Patterson St
- 220 N Westlawn St
- 26.75 Acres W Springfield St
- 0 W Springfield St
- 214 N Westlawn St
- 578 W Jefferson St
- 201 N Patterson St
- 556 W Jefferson St
- 202 N Westlawn St
- 544 W Jefferson St
- 190 N Patterson St
- 127 N Patterson St
- 607 W Jefferson St
- 527 W Springfield Rd
- 225 N Westlawn St
- 124 N Westlawn St
- 541 W Jefferson St