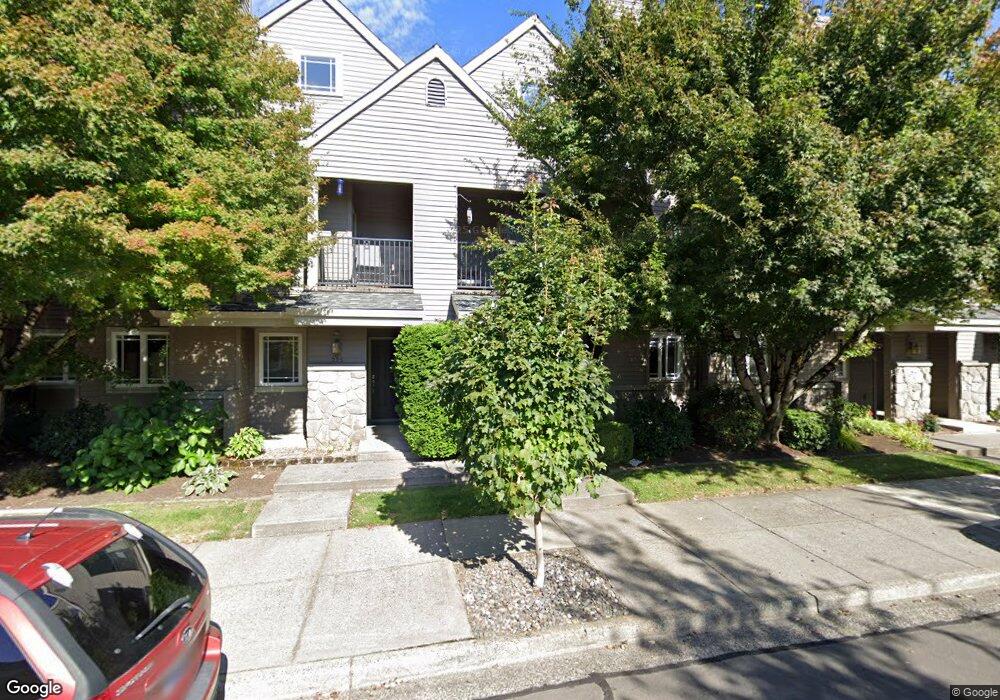
235 NE 4th St Gresham, OR 97030
Downtown Gresham NeighborhoodEstimated Value: $397,992 - $481,000
2
Beds
3
Baths
1,746
Sq Ft
$250/Sq Ft
Est. Value
About This Home
This home is located at 235 NE 4th St, Gresham, OR 97030 and is currently estimated at $436,248, approximately $249 per square foot. 235 NE 4th St is a home located in Multnomah County with nearby schools including East Gresham Elementary School, Dexter McCarty Middle School, and Gresham High School.
Ownership History
Date
Name
Owned For
Owner Type
Purchase Details
Closed on
Sep 11, 2024
Sold by
Crippen Ronald E and Brown Candace M
Bought by
Ronald Crippen & Candace Brown Revocable Livi and Crippen
Current Estimated Value
Purchase Details
Closed on
Jan 5, 2017
Sold by
Burbach Richard
Bought by
Crippen Ronald E and Brown Candace M
Home Financials for this Owner
Home Financials are based on the most recent Mortgage that was taken out on this home.
Original Mortgage
$245,000
Interest Rate
4.03%
Mortgage Type
New Conventional
Purchase Details
Closed on
Mar 20, 2014
Sold by
Lcb Llc
Bought by
Burbach Richard and Burbach Sharon
Purchase Details
Closed on
Dec 7, 1999
Sold by
Dewitte Lucile I
Bought by
Lcb Llc
Purchase Details
Closed on
Apr 9, 1997
Sold by
Gra Development Inc
Bought by
Dewitte Lucile L
Home Financials for this Owner
Home Financials are based on the most recent Mortgage that was taken out on this home.
Original Mortgage
$66,900
Interest Rate
7.86%
Mortgage Type
Purchase Money Mortgage
Create a Home Valuation Report for This Property
The Home Valuation Report is an in-depth analysis detailing your home's value as well as a comparison with similar homes in the area
Home Values in the Area
Average Home Value in this Area
Purchase History
| Date | Buyer | Sale Price | Title Company |
|---|---|---|---|
| Ronald Crippen & Candace Brown Revocable Livi | -- | None Listed On Document | |
| Crippen Ronald E | $310,000 | Fidelity Natl Title Oregon | |
| Burbach Richard | $243,000 | Fidelity National Title Or | |
| Lcb Llc | -- | -- | |
| Dewitte Lucile L | $186,900 | Fidelity National Title Co |
Source: Public Records
Mortgage History
| Date | Status | Borrower | Loan Amount |
|---|---|---|---|
| Previous Owner | Crippen Ronald E | $245,000 | |
| Previous Owner | Dewitte Lucile L | $66,900 |
Source: Public Records
Tax History
| Year | Tax Paid | Tax Assessment Tax Assessment Total Assessment is a certain percentage of the fair market value that is determined by local assessors to be the total taxable value of land and additions on the property. | Land | Improvement |
|---|---|---|---|---|
| 2025 | $6,359 | $312,480 | -- | -- |
| 2024 | $6,087 | $303,380 | -- | -- |
| 2023 | $5,546 | $294,550 | $0 | $0 |
| 2022 | $5,391 | $285,980 | $0 | $0 |
| 2021 | $5,255 | $277,660 | $0 | $0 |
| 2020 | $4,945 | $269,580 | $0 | $0 |
| 2019 | $4,815 | $261,730 | $0 | $0 |
| 2018 | $4,591 | $254,110 | $0 | $0 |
| 2017 | $4,405 | $246,710 | $0 | $0 |
| 2016 | $3,884 | $239,530 | $0 | $0 |
Source: Public Records
Map
Nearby Homes
- 210 NE 5th St
- 318 NE Roberts Ave Unit 308
- 318 NE Roberts Ave Unit 203
- 0 NE 5th St
- 491 NE Elliott Ave
- 660 NE 9th St
- 894 NE Linden Ave
- 234 NE Cleveland Ave
- 54 NW 13th St
- 415 SE Roberts Ave
- 417 SE Roberts Ave
- 0 NE 6th St
- 1783 1791 NE Beech Place
- 349 NE 18th St
- 4740 SE 2nd St
- 4764 SE 2nd St
- 4667 SE 2nd St
- 638 SW 7th St
- 1113 W Powell Blvd
- 159 SW Florence Ave Unit 64
Your Personal Tour Guide
Ask me questions while you tour the home.