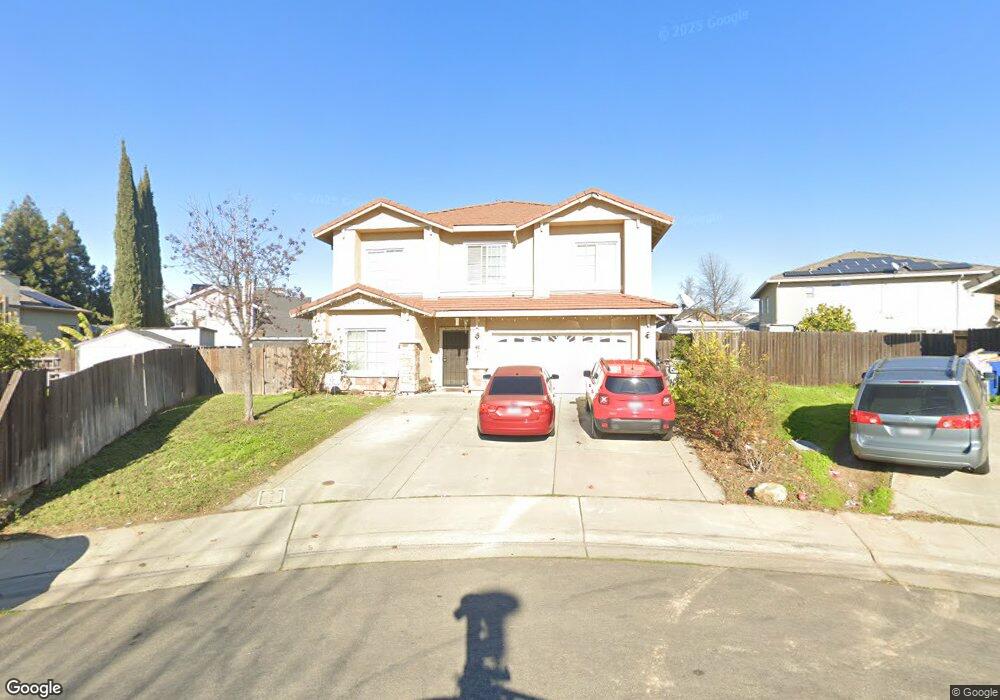
235 Peach Leaf Way Sacramento, CA 95838
Northpointe NeighborhoodEstimated Value: $555,000 - $631,000
6
Beds
3
Baths
2,748
Sq Ft
$215/Sq Ft
Est. Value
About This Home
This home is located at 235 Peach Leaf Way, Sacramento, CA 95838 and is currently estimated at $589,566, approximately $214 per square foot. 235 Peach Leaf Way is a home located in Sacramento County with nearby schools including Robla Elementary School, Rio Linda Preparatory Academy, and Norwood Junior High School.
Ownership History
Date
Name
Owned For
Owner Type
Purchase Details
Closed on
Jun 2, 2009
Sold by
Aurora Loan Services Llc
Bought by
Hampton Paul K and Hampton Candice M
Current Estimated Value
Home Financials for this Owner
Home Financials are based on the most recent Mortgage that was taken out on this home.
Original Mortgage
$239,580
Interest Rate
5.59%
Mortgage Type
Purchase Money Mortgage
Purchase Details
Closed on
Mar 17, 2009
Sold by
Indalecio Dante
Bought by
Aurora Loan Services Llc
Purchase Details
Closed on
Dec 21, 2006
Sold by
Sully St Llc
Bought by
Indalecio Dante
Home Financials for this Owner
Home Financials are based on the most recent Mortgage that was taken out on this home.
Original Mortgage
$460,000
Interest Rate
2%
Mortgage Type
Negative Amortization
Create a Home Valuation Report for This Property
The Home Valuation Report is an in-depth analysis detailing your home's value as well as a comparison with similar homes in the area
Home Values in the Area
Average Home Value in this Area
Purchase History
| Date | Buyer | Sale Price | Title Company |
|---|---|---|---|
| Hampton Paul K | $244,000 | Multiple | |
| Aurora Loan Services Llc | $224,400 | Accommodation | |
| Indalecio Dante | $575,000 | Stewart Title Of Sacramento | |
| Indalecio Dante | -- | Stewart Title Of Sacramento |
Source: Public Records
Mortgage History
| Date | Status | Borrower | Loan Amount |
|---|---|---|---|
| Previous Owner | Hampton Paul K | $239,580 | |
| Previous Owner | Indalecio Dante | $460,000 |
Source: Public Records
Tax History
| Year | Tax Paid | Tax Assessment Tax Assessment Total Assessment is a certain percentage of the fair market value that is determined by local assessors to be the total taxable value of land and additions on the property. | Land | Improvement |
|---|---|---|---|---|
| 2025 | $4,004 | $314,946 | $38,717 | $276,229 |
| 2024 | $4,004 | $308,771 | $37,958 | $270,813 |
| 2023 | $4,142 | $302,717 | $37,214 | $265,503 |
| 2022 | $3,907 | $296,783 | $36,485 | $260,298 |
| 2021 | $3,907 | $290,965 | $35,770 | $255,195 |
| 2020 | $3,832 | $287,983 | $35,404 | $252,579 |
| 2019 | $3,817 | $282,337 | $34,710 | $247,627 |
| 2018 | $3,533 | $276,802 | $34,030 | $242,772 |
| 2017 | $4,231 | $271,375 | $33,363 | $238,012 |
| 2016 | $3,498 | $266,055 | $32,709 | $233,346 |
| 2015 | $3,224 | $262,059 | $32,218 | $229,841 |
| 2014 | $3,269 | $256,926 | $31,587 | $225,339 |
Source: Public Records
Map
Nearby Homes
- 10 Smokey Leaf Ct
- 4 Coso Ct
- 114 Pinedale Ave
- 1 Pinache Ct
- 581 Main Ave
- 521 Exchange St
- 4824 Taylor St
- 4851 Warren Ave
- 213 Arbor Crest Way
- 640 Pinedale Ave
- 5111 Coppersmith Ave
- 4528 Austin St
- 31 Butterwick Ct
- 4640 Seanpatrick Dr
- 782 Crosswind Dr
- 653 Claire Ave
- 4650 Debralee Way
- 4942 Wind Creek Dr
- 4391 Burgess Dr
- 541 Samuel Way
- 239 Peach Leaf Way
- 10 Fire Leaf Ct
- 14 Fire Leaf Ct
- 4850 Amber Leaf Way
- 6 Fire Leaf Ct
- 291 Delta Leaf Way
- 4844 Amber Leaf Way
- 18 Fire Leaf Ct
- 287 Delta Leaf Way
- 245 Peach Leaf Way
- 2 Fire Leaf Ct
- 22 Fire Leaf Ct
- 283 Peach Leaf Way
- 230 Peach Leaf Way
- 26 Fire Leaf Ct
- 236 Peach Leaf Way
- 295 Delta Leaf Way
- 30 Fire Leaf Ct
- 9 Fire Leaf Ct
- 15 Fire Leaf Ct
Your Personal Tour Guide
Ask me questions while you tour the home.