235 S Main St Lynndyl, UT 84640
Estimated Value: $242,000 - $455,330
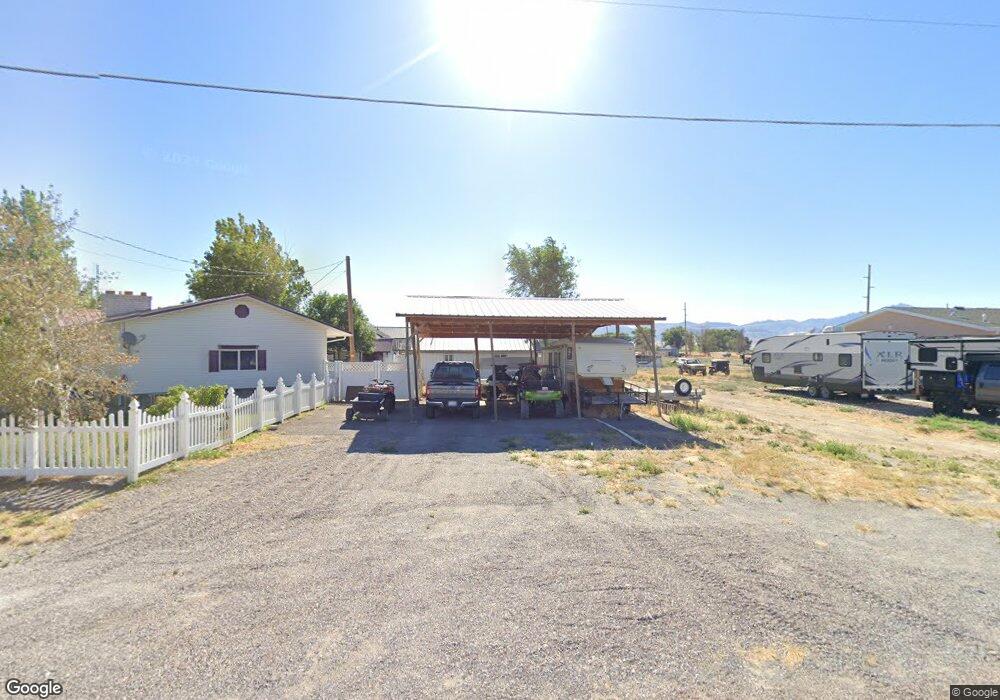
About This Home
This home is located at 235 S Main St, Lynndyl, UT 84640 and is currently estimated at $376,110. 235 S Main St is a home.
Ownership History
We collect this data history from publicly available records. To have your information removed, we recommend requesting removal directly through your county’s website.
Purchase Details
Home Financials for this Owner
Home Financials are based on the most recent Mortgage that was taken out on this home.Purchase Details
Home Financials for this Owner
Home Financials are based on the most recent Mortgage that was taken out on this home.Purchase Details
Home Financials for this Owner
Home Financials are based on the most recent Mortgage that was taken out on this home.Purchase History
We collect this data history from publicly available records. To have your information removed, we recommend requesting removal directly through your county’s website.
| Date | Buyer | Sale Price | Title Company |
|---|---|---|---|
| -- | -- | ||
| -- | -- | ||
| -- | None Available | ||
| -- | None Available | ||
| -- | None Listed On Document |
Mortgage History
We collect this data history from publicly available records. To have your information removed, we recommend requesting removal directly through your county’s website.
| Date | Status | Borrower | Loan Amount |
|---|---|---|---|
| Open | $195,000 | ||
| Closed | $195,000 |
Tax History
We collect this data history from publicly available records. To have your information removed, we recommend requesting removal directly through your county’s website.
| Year | Tax Paid | Tax Assessment Tax Assessment Total Assessment is a certain percentage of the fair market value that is determined by local assessors to be the total taxable value of land and additions on the property. | Land | Improvement |
|---|---|---|---|---|
| 2025 | $2,151 | $281,732 | $32,385 | $249,347 |
| 2024 | $2,151 | $291,799 | $18,457 | $273,342 |
| 2023 | $2,610 | $291,799 | $18,457 | $273,342 |
| 2022 | $1,724 | $161,912 | $14,766 | $147,146 |
| 2021 | $1,600 | $144,918 | $12,839 | $132,079 |
| 2020 | $1,396 | $127,712 | $11,672 | $116,040 |
| 2019 | $1,341 | $123,376 | $17,243 | $106,133 |
| 2018 | $1,292 | $121,808 | $15,675 | $106,133 |
| 2017 | $1,351 | $121,808 | $15,675 | $106,133 |
| 2016 | $1,310 | $123,189 | $7,301 | $115,888 |
| 2015 | $1,310 | $123,189 | $7,301 | $115,888 |
| 2014 | -- | $123,189 | $7,301 | $115,888 |
| 2013 | -- | $123,189 | $7,301 | $115,888 |
Map
- 195 E 200 South St
- 115 W 200 S
- 135 E 200 N
- 73 E 700 S
- 0 County Road 4616
- 4909 W 6150 S
- 80 W 470 N
- 11 S 200 E
- 479 E 100 N
- 1565 W Sunflower Ln Unit 3
- 1615 W Sunflower Ln
- 1615 W Sunflower Ln Unit 4
- 1565 W Sunflower Ln
- 0 Tbd Black Rock Rd Unit LotWP001
- 2000 N West Frontage I-15
- 1100 S 725 Rd W
- 310 S 500 West Rd
- 465 S 100 W
- 760 E 700 St S
- 155 E 500 St S
Ask me questions while you tour the home.