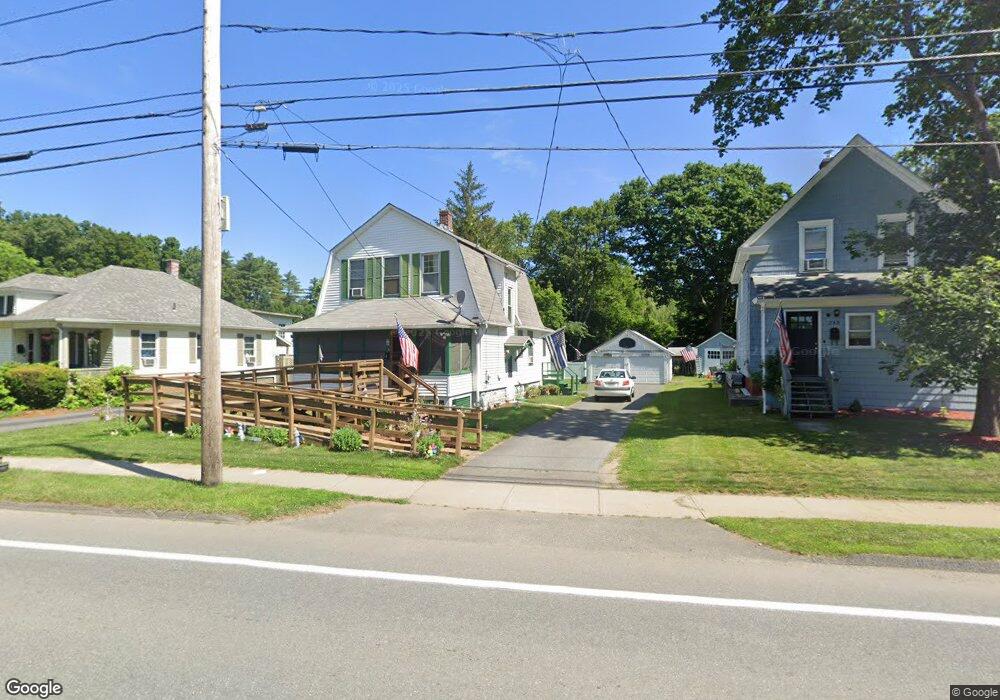
235 Silver St Greenfield, MA 01301
Estimated Value: $206,000 - $326,000
2
Beds
2
Baths
1,166
Sq Ft
$232/Sq Ft
Est. Value
About This Home
This home is located at 235 Silver St, Greenfield, MA 01301 and is currently estimated at $269,967, approximately $231 per square foot. 235 Silver St is a home located in Franklin County with nearby schools including Cornerstone Christian School, Holy Trinity School, and Stoneleigh-Burnham School.
Ownership History
Date
Name
Owned For
Owner Type
Purchase Details
Closed on
Oct 16, 2009
Sold by
Paulin Alma J
Bought by
Paulin Robert E
Current Estimated Value
Purchase Details
Closed on
Sep 25, 1987
Sold by
Richardson Bruce W
Bought by
Poulin Robert E
Create a Home Valuation Report for This Property
The Home Valuation Report is an in-depth analysis detailing your home's value as well as a comparison with similar homes in the area
Home Values in the Area
Average Home Value in this Area
Purchase History
| Date | Buyer | Sale Price | Title Company |
|---|---|---|---|
| Paulin Robert E | -- | -- | |
| Paulin Robert E | -- | -- | |
| Poulin Robert E | $57,000 | -- |
Source: Public Records
Mortgage History
| Date | Status | Borrower | Loan Amount |
|---|---|---|---|
| Open | Poulin Robert E | $74,000 | |
| Closed | Poulin Robert E | $29,398 | |
| Previous Owner | Poulin Robert E | $10,000 |
Source: Public Records
Tax History Compared to Growth
Tax History
| Year | Tax Paid | Tax Assessment Tax Assessment Total Assessment is a certain percentage of the fair market value that is determined by local assessors to be the total taxable value of land and additions on the property. | Land | Improvement |
|---|---|---|---|---|
| 2025 | $4,051 | $207,100 | $68,400 | $138,700 |
| 2024 | $3,956 | $194,000 | $56,300 | $137,700 |
| 2023 | $3,588 | $182,600 | $56,300 | $126,300 |
| 2022 | $3,248 | $145,500 | $53,600 | $91,900 |
| 2021 | $3,170 | $136,500 | $53,600 | $82,900 |
| 2020 | $3,061 | $133,500 | $53,600 | $79,900 |
| 2019 | $2,829 | $126,500 | $46,600 | $79,900 |
| 2018 | $2,779 | $123,900 | $45,600 | $78,300 |
| 2017 | $2,692 | $123,900 | $45,600 | $78,300 |
| 2016 | $2,757 | $126,400 | $48,300 | $78,100 |
| 2015 | $2,710 | $120,400 | $48,300 | $72,100 |
| 2014 | $2,472 | $120,400 | $48,300 | $72,100 |
Source: Public Records
Map
Nearby Homes