Estimated Value: $216,000 - $397,000
--
Bed
2
Baths
1,470
Sq Ft
$199/Sq Ft
Est. Value
About This Home
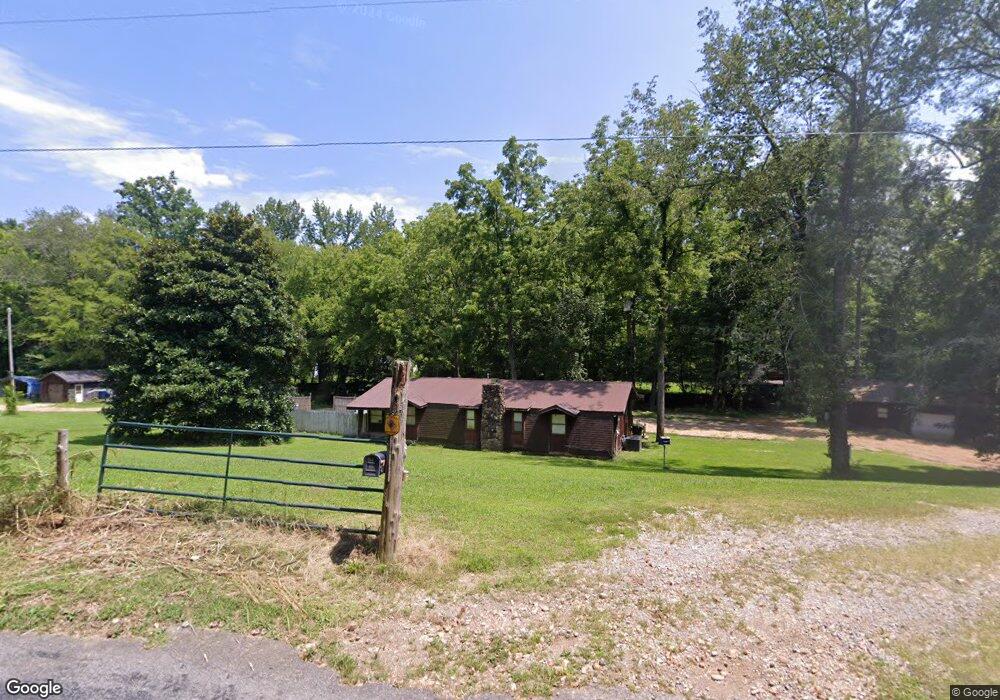
This home is located at 235 Upper Standing Rock Rd, Dover, TN 37058 and is currently estimated at $292,100, approximately $198 per square foot. 235 Upper Standing Rock Rd is a home located in Stewart County with nearby schools including Dover Elementary School, Stewart County Middle School, and Stewart County High School.
Ownership History
Date
Name
Owned For
Owner Type
Purchase Details
Closed on
Feb 3, 2025
Sold by
Pulley Gerry D
Bought by
Pulley Gerry D and Pulley Teresa D
Current Estimated Value
Purchase Details
Closed on
Jan 22, 2007
Sold by
Irizarry Nicole L
Bought by
Michael Lozano
Purchase Details
Closed on
Aug 29, 2005
Sold by
Not Provided
Bought by
Irizarry Nicole L
Home Financials for this Owner
Home Financials are based on the most recent Mortgage that was taken out on this home.
Original Mortgage
$72,000
Interest Rate
7.38%
Mortgage Type
Cash
Purchase Details
Closed on
Aug 2, 1999
Bought by
Irizarry Christopher J and Irizarry Nicole L
Purchase Details
Closed on
Apr 10, 1987
Bought by
Lehman Walter A and Lehman Evelyn
Create a Home Valuation Report for This Property
The Home Valuation Report is an in-depth analysis detailing your home's value as well as a comparison with similar homes in the area
Home Values in the Area
Average Home Value in this Area
Purchase History
| Date | Buyer | Sale Price | Title Company |
|---|---|---|---|
| Pulley Gerry D | -- | Stewart Title | |
| Pulley Gerry D | -- | Stewart Title | |
| Michael Lozano | $82,400 | -- | |
| Irizarry Nicole L | -- | -- | |
| Irizarry Christopher J | $80,500 | -- | |
| Lehman Walter A | -- | -- |
Source: Public Records
Mortgage History
| Date | Status | Borrower | Loan Amount |
|---|---|---|---|
| Previous Owner | Irizarry Nicole L | $72,000 |
Source: Public Records
Tax History Compared to Growth
Tax History
| Year | Tax Paid | Tax Assessment Tax Assessment Total Assessment is a certain percentage of the fair market value that is determined by local assessors to be the total taxable value of land and additions on the property. | Land | Improvement |
|---|---|---|---|---|
| 2025 | $764 | $51,425 | $0 | $0 |
| 2024 | $764 | $51,425 | $14,525 | $36,900 |
| 2023 | $752 | $31,850 | $9,675 | $22,175 |
| 2022 | $752 | $31,850 | $9,675 | $22,175 |
| 2021 | $752 | $31,850 | $9,675 | $22,175 |
| 2020 | $833 | $31,850 | $9,675 | $22,175 |
| 2019 | $833 | $32,700 | $9,675 | $23,025 |
| 2018 | $833 | $32,700 | $9,675 | $23,025 |
| 2017 | $833 | $32,700 | $9,675 | $23,025 |
| 2016 | $833 | $32,700 | $9,675 | $23,025 |
| 2015 | $808 | $32,700 | $9,675 | $23,025 |
| 2014 | $739 | $30,375 | $9,675 | $20,700 |
| 2013 | $739 | $29,917 | $0 | $0 |
Source: Public Records
Map
Nearby Homes
- 0 Old Hwy 18
- N Fork Rd
- 0 N Fork Rd Unit RTC2810696
- 0 Old Highway 18 Unit 24351588
- 0 Old Highway 18 Unit RTC2969875
- 0 Old Highway 18 Unit RTC2964512
- 0 Old Highway 18 Unit RTC2969861
- 0 Old Highway 18 Unit RTC2969910
- 0 Settle Rd
- 01 Terrapin Run Rd
- 1 Terrapin Run Rd
- 738 Keel Hollow Rd
- 0 Hurricane Rd NE Unit RTC2762788
- 212 Skyline Ridge
- 0 Hurricane Rd SE Unit RTC2762799
- 0 Hurricane Rd SE Unit RTC2762795
- 0 Hurricane Rd SE Unit RTC2762797
- 601 Anglin Ridge Rd
- 314 Ginger Dr
- 120 Ginger Dr
- 234 Upper Standing Rock Rd
- 226 Upper Standing Rock Rd
- 214 Upper Standing Rock Rd
- 224 Upper Standing Rock Rd
- 305 Upper Standing Rock Rd
- 164 Maddox Rd
- 166 Upper Standing Rock Rd
- 203 Upper Standing Rock Rd
- 172 Maddox Rd
- 198 Parker Ln
- 154 Upper Standing Rock Rd
- 154 Upper Standing Rock Rd
- 162 Upper Standing Rock Rd
- 330 Upper Standing Rock Rd
- 140 Upper Standing Rock Rd
- 231 Parker Ln
- 207 Parker Ln
- 1435 Leatherwood Rd
- 115 Parker Ln
- 440 Upper Standing Rock Rd