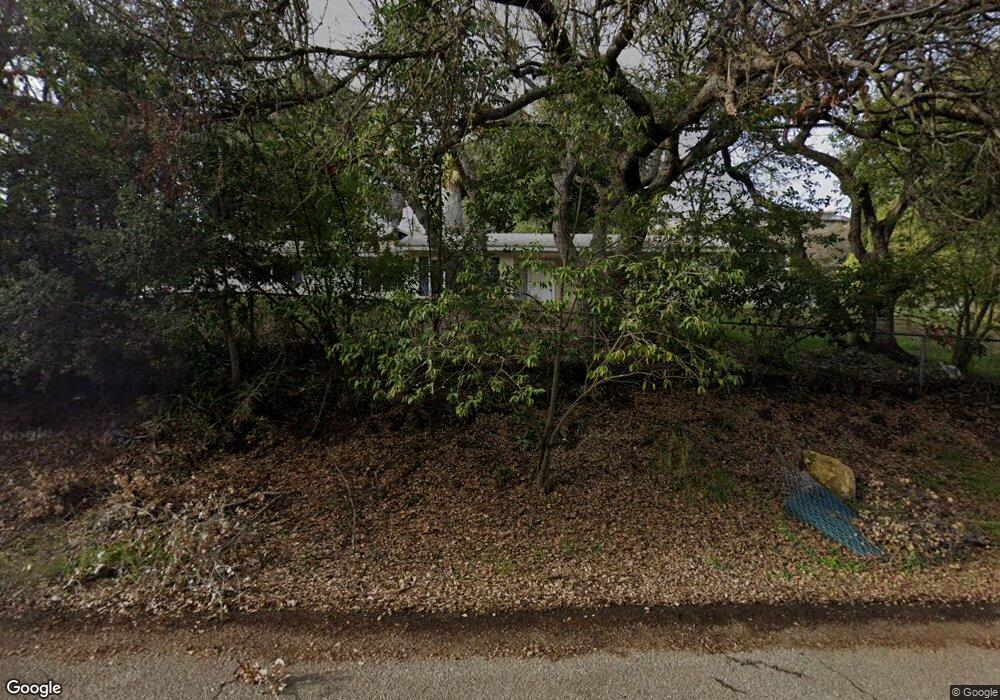
235 W 17th St Unit WE Paso Robles, CA 93446
Estimated Value: $776,142 - $914,000
3
Beds
2
Baths
1,300
Sq Ft
$638/Sq Ft
Est. Value
About This Home
This home is located at 235 W 17th St Unit WE, Paso Robles, CA 93446 and is currently estimated at $829,036, approximately $637 per square foot. 235 W 17th St Unit WE is a home located in San Luis Obispo County with nearby schools including Glen Speck Elementary School, George H. Flamson Middle School, and Paso Robles High School.
Ownership History
Date
Name
Owned For
Owner Type
Purchase Details
Closed on
Jan 24, 2019
Sold by
Morin Roberto C and Morin Robert C
Bought by
Morin Roberto C
Current Estimated Value
Home Financials for this Owner
Home Financials are based on the most recent Mortgage that was taken out on this home.
Original Mortgage
$404,100
Outstanding Balance
$354,561
Interest Rate
4.5%
Mortgage Type
New Conventional
Estimated Equity
$474,475
Purchase Details
Closed on
Dec 4, 2017
Sold by
Hutchins Scott and Hutchins Melody
Bought by
Morin Robert C
Home Financials for this Owner
Home Financials are based on the most recent Mortgage that was taken out on this home.
Original Mortgage
$402,500
Interest Rate
3.95%
Mortgage Type
New Conventional
Purchase Details
Closed on
Jul 31, 2012
Sold by
Hutchins Scott W
Bought by
Hutchins Scott and Hutchins Melody
Purchase Details
Closed on
Jan 19, 2011
Sold by
Rounds Christopher and Grimes Randy T
Bought by
Hutchins Scott W
Purchase Details
Closed on
Mar 8, 2006
Sold by
Erickson Laura
Bought by
Rounds Christopher and Grimes Randy T
Home Financials for this Owner
Home Financials are based on the most recent Mortgage that was taken out on this home.
Original Mortgage
$48,700
Interest Rate
6.29%
Mortgage Type
Credit Line Revolving
Purchase Details
Closed on
May 15, 2002
Sold by
Ortiz Benito B
Bought by
Erickson Laura
Home Financials for this Owner
Home Financials are based on the most recent Mortgage that was taken out on this home.
Original Mortgage
$180,000
Interest Rate
6.83%
Purchase Details
Closed on
Apr 30, 2002
Sold by
Einolander John C and Einolander Sue L
Bought by
Erickson Laura
Home Financials for this Owner
Home Financials are based on the most recent Mortgage that was taken out on this home.
Original Mortgage
$180,000
Interest Rate
6.83%
Purchase Details
Closed on
May 13, 1998
Sold by
Arbabi Fred and Arbabi Marian D
Bought by
Gilbert Justin and Gilbert Francesca B
Purchase Details
Closed on
Sep 18, 1996
Sold by
Darrow Estelle J and Bunting Estelle J
Bought by
Arbabi Fred and Arbabi Marian D
Purchase Details
Closed on
Nov 14, 1994
Sold by
Heussler Charles M and Heussler Jean M
Bought by
Bunting Jonathan E and Bunting Estelle J
Home Financials for this Owner
Home Financials are based on the most recent Mortgage that was taken out on this home.
Original Mortgage
$111,500
Interest Rate
8.92%
Create a Home Valuation Report for This Property
The Home Valuation Report is an in-depth analysis detailing your home's value as well as a comparison with similar homes in the area
Purchase History
| Date | Buyer | Sale Price | Title Company |
|---|---|---|---|
| Morin Roberto C | -- | Fidelity National Title Co | |
| Morin Robert C | $415,000 | First American Title Company | |
| Hutchins Scott | -- | None Available | |
| Hutchins Scott W | $225,000 | Fidelity National Title Co | |
| Hutchins Scott W | -- | Fidelity National Title Co | |
| Rounds Christopher | $487,000 | United Independent Title | |
| Erickson Laura | -- | Fidelity Title Company | |
| Erickson Laura | $278,500 | Fidelity Title Company | |
| Gilbert Justin | $165,000 | First American Title | |
| Arbabi Fred | $125,000 | Fidelity National Title Co | |
| Bunting Estelle J | -- | Fidelity National Title Co | |
| Bunting Jonathan E | $151,500 | First American Title Ins Co |
Source: Public Records
Mortgage History
| Date | Status | Borrower | Loan Amount |
|---|---|---|---|
| Open | Morin Roberto C | $404,100 | |
| Closed | Morin Robert C | $402,500 | |
| Previous Owner | Rounds Christopher | $48,700 | |
| Previous Owner | Rounds Christopher | $389,600 | |
| Previous Owner | Erickson Laura | $180,000 | |
| Previous Owner | Bunting Jonathan E | $111,500 |
Source: Public Records
Tax History
| Year | Tax Paid | Tax Assessment Tax Assessment Total Assessment is a certain percentage of the fair market value that is determined by local assessors to be the total taxable value of land and additions on the property. | Land | Improvement |
|---|---|---|---|---|
| 2025 | $5,147 | $472,193 | $256,009 | $216,184 |
| 2024 | $5,063 | $462,936 | $250,990 | $211,946 |
| 2023 | $5,063 | $453,860 | $246,069 | $207,791 |
| 2022 | $4,987 | $444,962 | $241,245 | $203,717 |
| 2021 | $4,902 | $436,238 | $236,515 | $199,723 |
| 2020 | $4,836 | $431,766 | $234,090 | $197,676 |
| 2019 | $4,767 | $423,300 | $229,500 | $193,800 |
| 2018 | $4,702 | $415,000 | $225,000 | $190,000 |
| 2017 | $2,699 | $248,376 | $110,389 | $137,987 |
| 2016 | $2,646 | $243,507 | $108,225 | $135,282 |
| 2015 | $2,636 | $239,850 | $106,600 | $133,250 |
| 2014 | $2,545 | $235,152 | $104,512 | $130,640 |
Source: Public Records
Map
Nearby Homes
- 235 W 17th St
- 115 Glencourt Ln
- 315 W 17th St
- 328 W 17th St
- 106 Glencourt Ln
- 125 Glencourt Ln
- 135 Glencourt Ln
- 215 W 17th St
- 145 Glencourt Ln
- 328 17th St
- 49 Hillcrest Dr
- 334 W 17th St
- 334 17th St
- 55 Hillcrest Dr
- 155 Glencourt Ln
- 1703 Highland Park Dr
- 1762 Highland Park Dr
- 57 Hillcrest Dr
- 346 17th St
- 165 Glencourt Ln
Your Personal Tour Guide
Ask me questions while you tour the home.