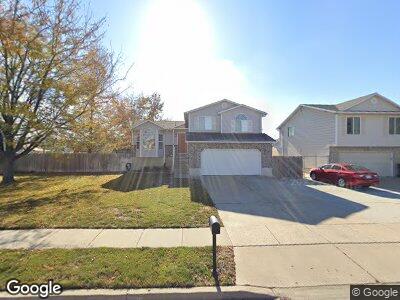
235 W 1900 S Clearfield, UT 84015
Estimated Value: $444,000 - $485,000
4
Beds
2
Baths
1,955
Sq Ft
$234/Sq Ft
Est. Value
About This Home
This home is located at 235 W 1900 S, Clearfield, UT 84015 and is currently estimated at $458,225, approximately $234 per square foot. 235 W 1900 S is a home located in Davis County with nearby schools including Antelope Elementary School, North Davis Junior High School, and Clearfield High School.
Ownership History
Date
Name
Owned For
Owner Type
Purchase Details
Closed on
Jun 27, 2019
Sold by
Bush Kyle M and Bush Katherine
Bought by
Ford David and Ford Heather
Current Estimated Value
Home Financials for this Owner
Home Financials are based on the most recent Mortgage that was taken out on this home.
Original Mortgage
$245,000
Interest Rate
4%
Mortgage Type
New Conventional
Purchase Details
Closed on
Apr 23, 2001
Sold by
Nelson Michael R
Bought by
Nelson Michael R and Nelson Julynne R
Home Financials for this Owner
Home Financials are based on the most recent Mortgage that was taken out on this home.
Original Mortgage
$118,000
Interest Rate
6.57%
Purchase Details
Closed on
Mar 21, 1996
Sold by
Woodside Homes Corp
Bought by
Nelson Michael R
Home Financials for this Owner
Home Financials are based on the most recent Mortgage that was taken out on this home.
Original Mortgage
$109,725
Interest Rate
6.98%
Mortgage Type
FHA
Create a Home Valuation Report for This Property
The Home Valuation Report is an in-depth analysis detailing your home's value as well as a comparison with similar homes in the area
Home Values in the Area
Average Home Value in this Area
Purchase History
| Date | Buyer | Sale Price | Title Company |
|---|---|---|---|
| Ford David | -- | Stewart Title Ins | |
| Nelson Michael R | -- | Backman Stewart Title Servic | |
| Nelson Michael R | -- | First American Title Co |
Source: Public Records
Mortgage History
| Date | Status | Borrower | Loan Amount |
|---|---|---|---|
| Open | Ford David | $246,600 | |
| Closed | Ford David | $245,000 | |
| Previous Owner | Nelson Michael R | $103,600 | |
| Previous Owner | Nelson Michael R | $118,000 | |
| Previous Owner | Nelson Michael R | $109,725 |
Source: Public Records
Tax History Compared to Growth
Tax History
| Year | Tax Paid | Tax Assessment Tax Assessment Total Assessment is a certain percentage of the fair market value that is determined by local assessors to be the total taxable value of land and additions on the property. | Land | Improvement |
|---|---|---|---|---|
| 2024 | $2,571 | $232,100 | $69,677 | $162,423 |
| 2023 | $2,354 | $390,000 | $111,447 | $278,553 |
| 2022 | $2,559 | $229,350 | $63,776 | $165,574 |
| 2021 | $2,319 | $314,000 | $68,064 | $245,936 |
| 2020 | $2,015 | $271,000 | $57,289 | $213,711 |
| 2019 | $1,929 | $256,000 | $59,862 | $196,138 |
| 2018 | $1,755 | $227,000 | $53,133 | $173,867 |
| 2016 | $1,437 | $97,185 | $21,242 | $75,943 |
| 2015 | $1,421 | $91,630 | $21,509 | $70,121 |
| 2014 | $1,377 | $89,979 | $21,509 | $68,470 |
| 2013 | -- | $84,072 | $30,258 | $53,814 |
Source: Public Records
Map
Nearby Homes
- 315 W 1900 S
- 42 W 1980 S
- 672 W 1900 S
- 2378 S 550 W
- 1897 S 830 W Unit C
- 2912 W 1475 N
- 1886 S 830 W Unit D
- 2912 W 1375 N
- 3391 W 1125 N
- 907 W 1840 S Unit B
- 1889 S 910 W Unit B
- 860 W 2225 S
- 1090 N 3450 W
- 1912 S 910 W Unit B
- 1052 N 3500 W
- 929 W 1920 S Unit A
- 954 W 1880 S
- 3254 W 1025 N
- 460 E 1700 S Unit 1 & 2
- 2669 S 150 E