Estimated Value: $404,000 - $459,713
4
Beds
2
Baths
1,464
Sq Ft
$299/Sq Ft
Est. Value
About This Home
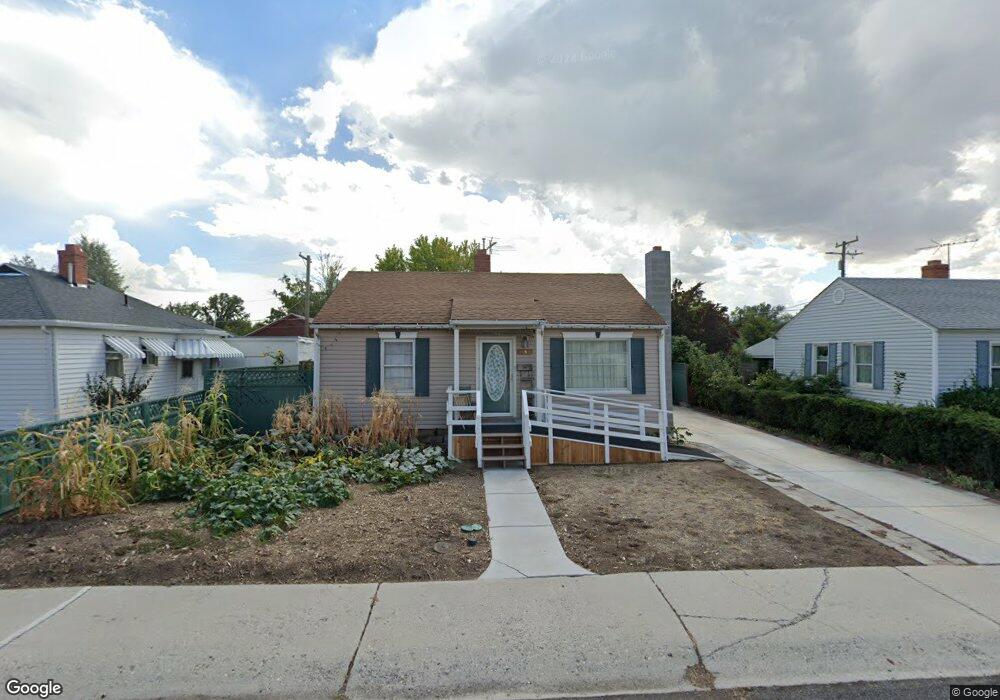
This home is located at 235 W 800 N, Lehi, UT 84043 and is currently estimated at $438,178, approximately $299 per square foot. 235 W 800 N is a home located in Utah County with nearby schools including Lehi Elementary School, Lehi Junior High School, and Lehi High School.
Ownership History
Date
Name
Owned For
Owner Type
Purchase Details
Closed on
Aug 10, 2016
Sold by
Southard Joshua B and Southard Betheany M
Bought by
Hall Daniel B and Hall Patricia
Current Estimated Value
Home Financials for this Owner
Home Financials are based on the most recent Mortgage that was taken out on this home.
Original Mortgage
$191,468
Outstanding Balance
$152,125
Interest Rate
3.35%
Mortgage Type
FHA
Estimated Equity
$286,053
Purchase Details
Closed on
Jan 26, 2001
Sold by
Makin Russell A and Makin Jody
Bought by
Southard Joshua B and Southard Bethany M
Home Financials for this Owner
Home Financials are based on the most recent Mortgage that was taken out on this home.
Original Mortgage
$118,937
Interest Rate
7.41%
Mortgage Type
FHA
Create a Home Valuation Report for This Property
The Home Valuation Report is an in-depth analysis detailing your home's value as well as a comparison with similar homes in the area
Home Values in the Area
Average Home Value in this Area
Purchase History
| Date | Buyer | Sale Price | Title Company |
|---|---|---|---|
| Hall Daniel B | -- | Mountain View Title | |
| Southard Joshua B | -- | Security Title & Abstract |
Source: Public Records
Mortgage History
| Date | Status | Borrower | Loan Amount |
|---|---|---|---|
| Open | Hall Daniel B | $191,468 | |
| Previous Owner | Southard Joshua B | $118,937 |
Source: Public Records
Tax History Compared to Growth
Tax History
| Year | Tax Paid | Tax Assessment Tax Assessment Total Assessment is a certain percentage of the fair market value that is determined by local assessors to be the total taxable value of land and additions on the property. | Land | Improvement |
|---|---|---|---|---|
| 2025 | $1,767 | $228,525 | $192,300 | $223,200 |
| 2024 | $1,767 | $206,745 | $0 | $0 |
| 2023 | $1,614 | $205,040 | $0 | $0 |
| 2022 | $1,730 | $213,125 | $0 | $0 |
| 2021 | $1,541 | $287,000 | $94,800 | $192,200 |
| 2020 | $1,453 | $267,400 | $87,800 | $179,600 |
| 2019 | $1,275 | $244,000 | $87,800 | $156,200 |
| 2018 | $1,194 | $216,100 | $80,300 | $135,800 |
| 2017 | $1,083 | $104,170 | $0 | $0 |
| 2016 | $1,080 | $96,415 | $0 | $0 |
| 2015 | $1,018 | $86,240 | $0 | $0 |
| 2014 | $938 | $78,980 | $0 | $0 |
Source: Public Records
Map
Nearby Homes
- 443 W 820 N
- 996 N 200 W
- 155 W State St Unit TRLR 3
- 68 W State St
- 7 E State St
- 1150 N 200 W Unit 6
- 4561 N McKechnie Way Dr Unit 1119
- 143 W 300 N
- 171 E 400 N
- 281 N Center St
- 1329 N 100 E Unit 21
- 578 N Woods Dr
- 705 N 400 E
- 1295 N 190 E
- 255 W 100 N
- 428 E 500 N
- 174 E 100 N
- 485 W Main St
- 1301 N 900 W Unit 12
- 902 W 1500 N