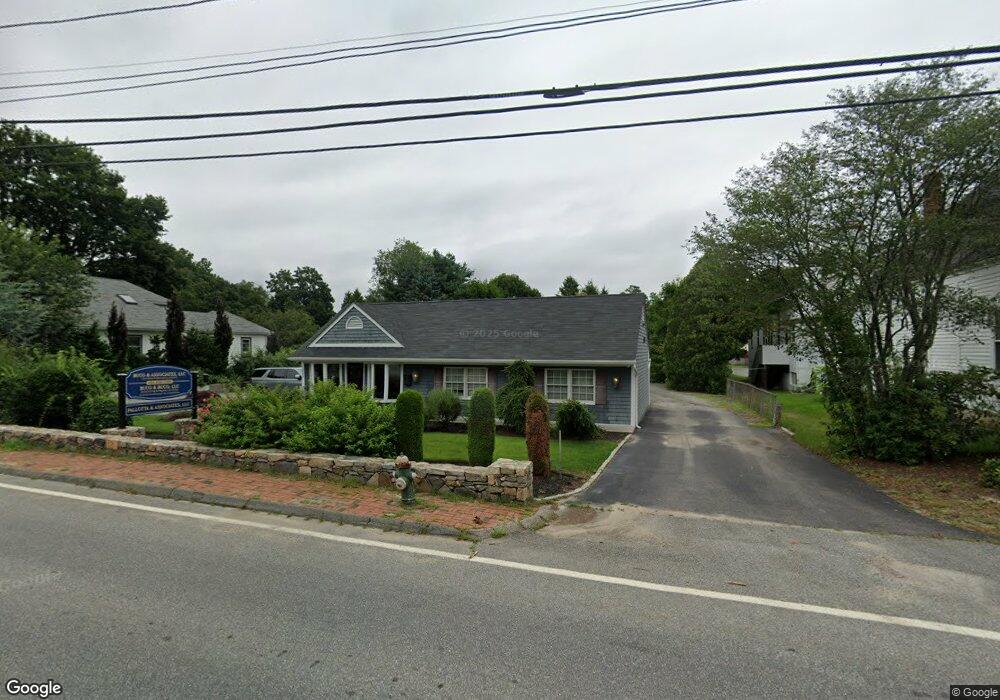
235 Wilbur Ave Cranston, RI 02921
Oaklawn NeighborhoodEstimated Value: $217,384
--
Bed
--
Bath
2,142
Sq Ft
$101/Sq Ft
Est. Value
About This Home
This home is located at 235 Wilbur Ave, Cranston, RI 02921 and is currently priced at $217,384, approximately $101 per square foot. 235 Wilbur Ave is a home located in Providence County with nearby schools including Oak Lawn School, Western Hills Middle School, and Cranston High School West.
Ownership History
Date
Name
Owned For
Owner Type
Purchase Details
Closed on
May 13, 2015
Sold by
Combined Investments L
Bought by
Mlk Realty Llc
Current Estimated Value
Purchase Details
Closed on
Oct 6, 2014
Sold by
Bach Robert E
Bought by
Bach Robert E and Bach Mia E
Purchase Details
Closed on
Oct 3, 2014
Sold by
Bach Robert E
Bought by
Combined Investments L
Purchase Details
Closed on
Dec 27, 2011
Sold by
Rec Investments Llc
Bought by
Bach Robert E and Bach Mia E
Purchase Details
Closed on
Aug 11, 2011
Sold by
Bach Robert E and Bach Mia E
Bought by
Rec Investments Llc
Purchase Details
Closed on
Aug 25, 2004
Sold by
Flynn David and Flynn Janice
Bought by
Bach Robert and Bach Mia
Purchase Details
Closed on
Aug 28, 1998
Sold by
Barton William R
Bought by
Flynn David M and Flynn Janice
Purchase Details
Closed on
Aug 26, 1993
Sold by
Locust Glen Realty Inc
Bought by
Barton William R and Barton Stephen G
Create a Home Valuation Report for This Property
The Home Valuation Report is an in-depth analysis detailing your home's value as well as a comparison with similar homes in the area
Home Values in the Area
Average Home Value in this Area
Purchase History
| Date | Buyer | Sale Price | Title Company |
|---|---|---|---|
| Mlk Realty Llc | $95,000 | -- | |
| Mlk Realty Llc | $95,000 | -- | |
| Bach Robert E | $7,664 | -- | |
| Bach Robert E | $7,664 | -- | |
| Combined Investments L | $140,000 | -- | |
| Combined Investments L | $140,000 | -- | |
| Bach Robert E | -- | -- | |
| Bach Robert E | -- | -- | |
| Rec Investments Llc | $4,657 | -- | |
| Rec Investments Llc | $4,657 | -- | |
| Bach Robert | $350,000 | -- | |
| Bach Robert | $350,000 | -- | |
| Flynn David M | $265,000 | -- | |
| Flynn David M | $265,000 | -- | |
| Barton William R | $155,000 | -- | |
| Barton William R | $155,000 | -- |
Source: Public Records
Mortgage History
| Date | Status | Borrower | Loan Amount |
|---|---|---|---|
| Open | Barton William R | $270,000 |
Source: Public Records
Tax History Compared to Growth
Tax History
| Year | Tax Paid | Tax Assessment Tax Assessment Total Assessment is a certain percentage of the fair market value that is determined by local assessors to be the total taxable value of land and additions on the property. | Land | Improvement |
|---|---|---|---|---|
| 2024 | $6,812 | $333,600 | $127,600 | $206,000 |
| 2023 | $6,968 | $245,800 | $87,900 | $157,900 |
| 2022 | $6,826 | $245,800 | $87,900 | $157,900 |
| 2021 | $6,637 | $245,800 | $87,900 | $157,900 |
| 2020 | $7,332 | $235,300 | $83,500 | $151,800 |
| 2019 | $7,332 | $235,300 | $83,500 | $151,800 |
| 2018 | $7,163 | $235,300 | $83,500 | $151,800 |
| 2017 | $7,095 | $206,200 | $61,500 | $144,700 |
| 2016 | $6,945 | $206,200 | $61,500 | $144,700 |
| 2015 | $4,722 | $140,200 | $61,500 | $78,700 |
| 2014 | $5,781 | $168,800 | $61,500 | $107,300 |
Source: Public Records
Map
Nearby Homes
- 239 Wilbur Ave
- 15 Gaglione Ct
- 14 Gaglione Ct
- 32 Brookdale Ave
- 238 Wilbur Ave
- 4 Brookdale Ave
- 23 Gaglione Ct
- 20 Gaglione Ct
- 208 Wilbur Ave
- 258 Wilbur Ave Unit 3
- 258 Wilbur Ave Unit 1
- 258 Wilbur Ave Unit 2
- 258 Wilbur Ave
- 271 Wilbur Ave
- 5 Cottonwood Dr
- 46 Brookdale Ave
- 1 Brookdale Ave
- 164 Natick Ave
- 14 Locust Glen Dr
- 200 Wilbur Ave