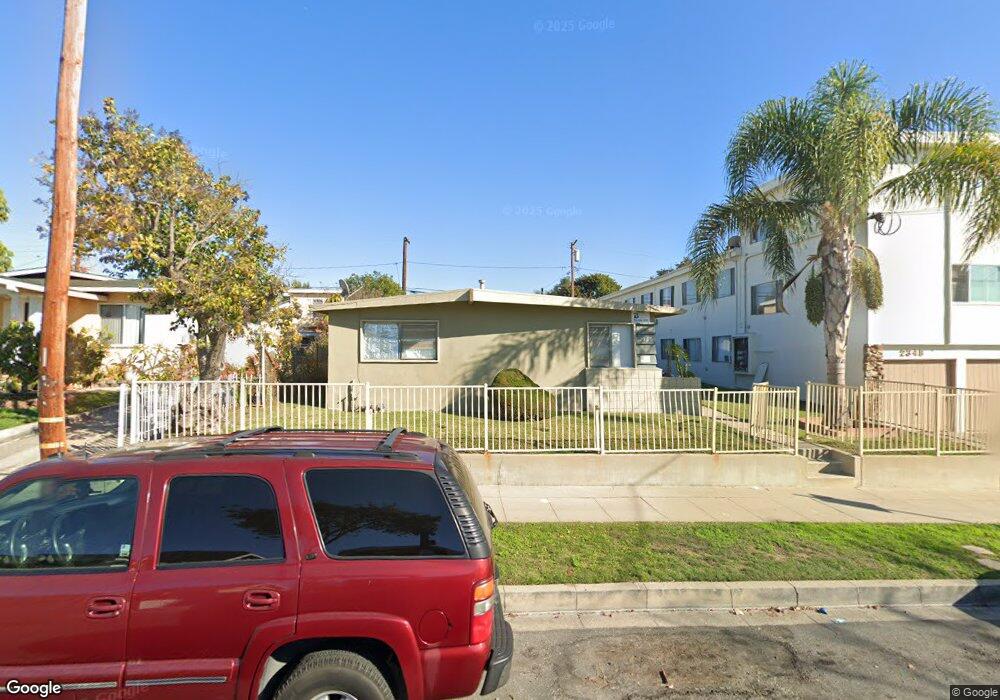
2350 Lemon Ave Signal Hill, CA 90755
Estimated Value: $1,113,379 - $1,247,000
5
Beds
4
Baths
2,624
Sq Ft
$448/Sq Ft
Est. Value
About This Home
This home is located at 2350 Lemon Ave, Signal Hill, CA 90755 and is currently estimated at $1,176,845, approximately $448 per square foot. 2350 Lemon Ave is a home located in Los Angeles County with nearby schools including Signal Hill Elementary School, Nelson Academy, and Long Beach Polytechnic High School.
Ownership History
Date
Name
Owned For
Owner Type
Purchase Details
Closed on
Aug 1, 2006
Sold by
Stone Lori A
Bought by
Stone Martin J
Current Estimated Value
Home Financials for this Owner
Home Financials are based on the most recent Mortgage that was taken out on this home.
Original Mortgage
$450,000
Outstanding Balance
$363,553
Interest Rate
6.76%
Mortgage Type
New Conventional
Estimated Equity
$813,292
Purchase Details
Closed on
May 14, 2004
Sold by
Stone Martin J
Bought by
Stone Lori A
Purchase Details
Closed on
Mar 3, 2004
Sold by
The Key Family Trust
Bought by
Stone Lori A
Home Financials for this Owner
Home Financials are based on the most recent Mortgage that was taken out on this home.
Original Mortgage
$400,000
Interest Rate
5.75%
Mortgage Type
Purchase Money Mortgage
Purchase Details
Closed on
Sep 20, 2002
Sold by
Key Clyde R and Key Shirley M
Bought by
Key Clyde R
Create a Home Valuation Report for This Property
The Home Valuation Report is an in-depth analysis detailing your home's value as well as a comparison with similar homes in the area
Home Values in the Area
Average Home Value in this Area
Purchase History
| Date | Buyer | Sale Price | Title Company |
|---|---|---|---|
| Stone Martin J | -- | Progressive Title Company | |
| Stone Lori A | -- | Equity Title | |
| Stone Lori A | $500,000 | Equity Title | |
| Key Clyde R | -- | -- |
Source: Public Records
Mortgage History
| Date | Status | Borrower | Loan Amount |
|---|---|---|---|
| Open | Stone Martin J | $450,000 | |
| Previous Owner | Stone Lori A | $400,000 |
Source: Public Records
Tax History Compared to Growth
Tax History
| Year | Tax Paid | Tax Assessment Tax Assessment Total Assessment is a certain percentage of the fair market value that is determined by local assessors to be the total taxable value of land and additions on the property. | Land | Improvement |
|---|---|---|---|---|
| 2025 | $10,036 | $710,875 | $390,983 | $319,892 |
| 2024 | $10,036 | $696,937 | $383,317 | $313,620 |
| 2023 | $9,870 | $683,272 | $375,801 | $307,471 |
| 2022 | $9,303 | $669,876 | $368,433 | $301,443 |
| 2021 | $9,116 | $656,742 | $361,209 | $295,533 |
| 2020 | $9,091 | $650,009 | $357,506 | $292,503 |
| 2019 | $8,996 | $637,265 | $350,497 | $286,768 |
| 2018 | $8,710 | $624,771 | $343,625 | $281,146 |
| 2016 | $8,063 | $600,513 | $330,283 | $270,230 |
| 2015 | $7,773 | $591,493 | $325,322 | $266,171 |
| 2014 | $7,290 | $540,000 | $324,000 | $216,000 |
Source: Public Records
Map
Nearby Homes
- 2225 Olive Ave
- 1211 E Leigh Ct
- 2051 Orange Ave
- 2370 Lime Ave
- 2240 Walnut Ave
- 2238 Walnut Ave
- 2599 Walnut Ave
- 1460 E Willow St Unit 202
- 1015 E 20th St
- 2366 Linden Ave
- 2420 Gaviota Ave
- 2430 Gaviota Ave
- 2298 Rose Ave Unit 110
- 2655 Walnut Ave
- 2310 Elm Ave
- 509 E 21st St
- 2240 N Legion Dr Unit 217
- 1872 Lemon Ave
- 2093 Pasadena Ave
- 1843 Cerritos Ave
- 2350 Lemon Ave Unit B
- 2352 Lemon Ave
- 2348 Lemon Ave
- 2364 Lemon Ave
- 2322 Lemon Ave
- 2368 Lemon Ave
- 2363 Cerritos Ave
- 2345 Cerritos Ave
- 2363 Lemon Ave
- 2320 Lemon Ave
- 2379 Cerritos Ave
- 2353 Lemon Ave
- 2335 Cerritos Ave
- 2343 Lemon Ave
- 2361 Lemon Ave
- 2372 Lemon Ave
- 2315 Cerritos Ave
- 2383 Cerritos Ave
- 2365 Lemon Ave
- 2341 Lemon Ave