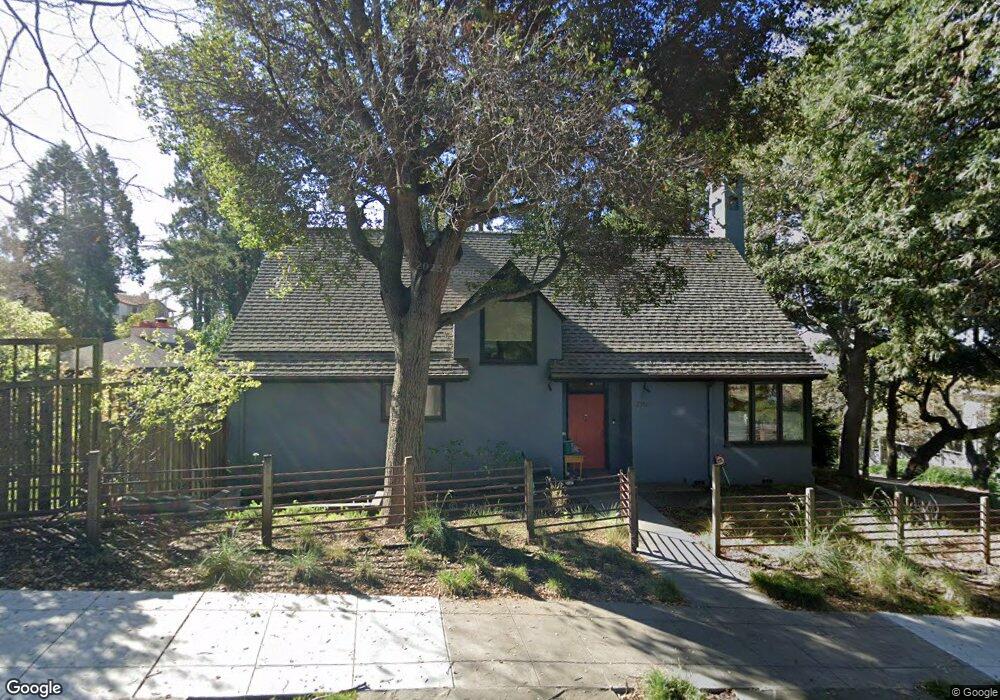
2350 Vine St Berkeley, CA 94708
North Berkeley NeighborhoodEstimated Value: $1,748,000 - $2,190,753
4
Beds
2
Baths
2,540
Sq Ft
$817/Sq Ft
Est. Value
About This Home
This home is located at 2350 Vine St, Berkeley, CA 94708 and is currently estimated at $2,074,438, approximately $816 per square foot. 2350 Vine St is a home located in Alameda County with nearby schools including Berkeley Arts Magnet at Whittier School, Cragmont Elementary School, and Washington Elementary School.
Ownership History
Date
Name
Owned For
Owner Type
Purchase Details
Closed on
Dec 21, 2011
Sold by
Schuchmann Hans P and Schuchmann Christine E
Bought by
Ringler Benjamin Scott and Overman Jennifer L
Current Estimated Value
Purchase Details
Closed on
Aug 25, 2005
Sold by
Lhermitte Patrick R and Goodsell Rebecca Louise
Bought by
Schuchmann Hans P and Schuchmann Christine E
Home Financials for this Owner
Home Financials are based on the most recent Mortgage that was taken out on this home.
Original Mortgage
$600,000
Interest Rate
6.12%
Mortgage Type
Purchase Money Mortgage
Create a Home Valuation Report for This Property
The Home Valuation Report is an in-depth analysis detailing your home's value as well as a comparison with similar homes in the area
Home Values in the Area
Average Home Value in this Area
Purchase History
| Date | Buyer | Sale Price | Title Company |
|---|---|---|---|
| Ringler Benjamin Scott | -- | Old Republic Title Company | |
| Lhermitte Patrick R | -- | Old Republic Title Company | |
| Schuchmann Hans P | $300,000 | New Century Title Company |
Source: Public Records
Mortgage History
| Date | Status | Borrower | Loan Amount |
|---|---|---|---|
| Previous Owner | Schuchmann Hans P | $600,000 |
Source: Public Records
Tax History
| Year | Tax Paid | Tax Assessment Tax Assessment Total Assessment is a certain percentage of the fair market value that is determined by local assessors to be the total taxable value of land and additions on the property. | Land | Improvement |
|---|---|---|---|---|
| 2025 | $26,045 | $1,770,945 | $531,283 | $1,239,662 |
| 2024 | $26,045 | $1,736,231 | $520,869 | $1,215,362 |
| 2023 | $25,467 | $1,702,194 | $510,658 | $1,191,536 |
| 2022 | $24,992 | $1,668,818 | $500,645 | $1,168,173 |
| 2021 | $25,082 | $1,636,107 | $490,832 | $1,145,275 |
| 2020 | $23,854 | $1,619,341 | $485,802 | $1,133,539 |
| 2019 | $23,040 | $1,587,603 | $476,281 | $1,111,322 |
| 2018 | $22,670 | $1,556,484 | $466,945 | $1,089,539 |
| 2017 | $21,912 | $1,525,971 | $457,791 | $1,068,180 |
| 2016 | $21,290 | $1,496,051 | $448,815 | $1,047,236 |
| 2015 | $21,012 | $1,473,590 | $442,077 | $1,031,513 |
| 2014 | $20,834 | $1,444,727 | $433,418 | $1,011,309 |
Source: Public Records
Map
Nearby Homes
- 1622 Scenic Ave
- 2501 Rose Walk
- 2421 Hilgard Ave
- 1515 Oxford St Unit 1D
- 2477 Virginia St
- 2301 Virginia St Unit 1
- 1444 Walnut St
- 2340 Virginia St
- 2451 Le Conte Ave
- 2600 Hilgard Ave
- 2201 Virginia St Unit 2
- 1682 Oxford St
- 1739 Spruce St
- 2634 Virginia St Unit 33
- 2315 Eunice St
- 1698 La Loma Ave Unit 1698
- 1408 Henry St
- 2686 Shasta Rd
- 2121 Eunice St
- 2700 Le Conte Ave Unit 301
- 1515 Scenic Ave
- 1525 Scenic Ave
- 2353 Vine St
- 2388 Vine St
- 1518 Hawthorne Terrace
- 2340 Vine St
- 1537 Scenic Ave
- 2390 Vine St
- 1492 Scenic Ave
- 1516 Scenic Ave
- 1479 Scenic Ave
- 1530 Hawthorne Terrace
- 1450 Hawthorne Terrace
- 1524 Scenic Ave
- 1532 Scenic Ave Unit 1
- 1536 Scenic Ave Unit 3
- 1534 Scenic Ave Unit 2
- 1542 Hawthorne Terrace
- 1545 Scenic Ave
- 1476 Scenic Ave
Your Personal Tour Guide
Ask me questions while you tour the home.