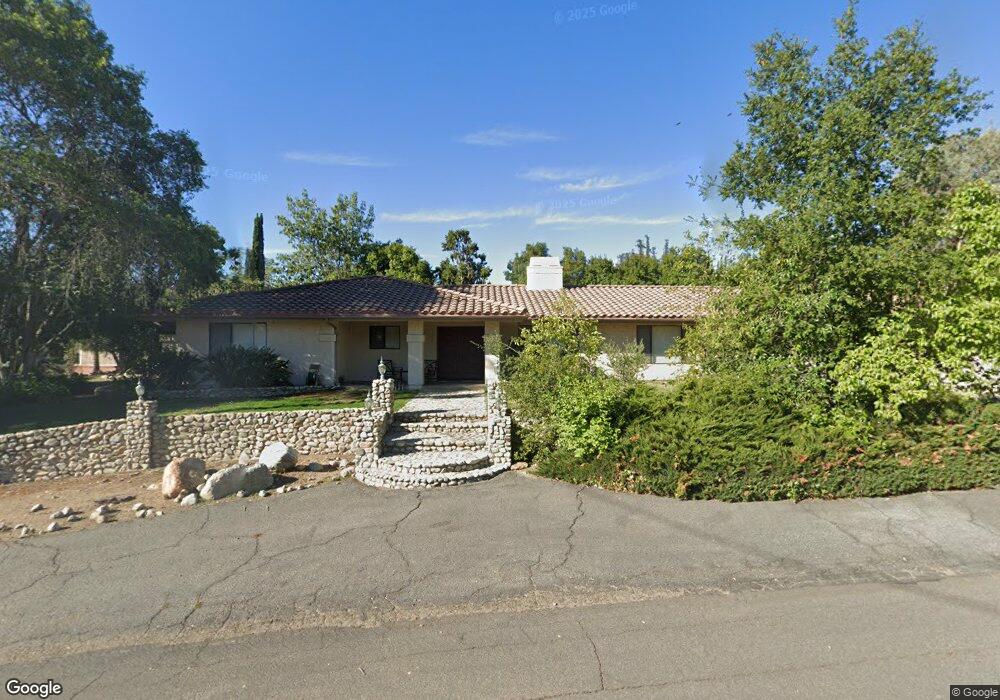
2351 Paloma Curve Upland, CA 91784
San Antonio Heights NeighborhoodEstimated Value: $1,105,422 - $1,373,000
4
Beds
3
Baths
2,742
Sq Ft
$458/Sq Ft
Est. Value
About This Home
This home is located at 2351 Paloma Curve, Upland, CA 91784 and is currently estimated at $1,256,606, approximately $458 per square foot. 2351 Paloma Curve is a home located in San Bernardino County with nearby schools including Valencia Elementary, Pioneer Junior High School, and Upland High School.
Ownership History
Date
Name
Owned For
Owner Type
Purchase Details
Closed on
Sep 9, 2014
Sold by
Goodman Maria
Bought by
Goodman Jason
Current Estimated Value
Purchase Details
Closed on
Jul 1, 1998
Sold by
Smith Manfred J
Bought by
Goodman Jason and Goodman Maria
Home Financials for this Owner
Home Financials are based on the most recent Mortgage that was taken out on this home.
Original Mortgage
$204,000
Outstanding Balance
$40,842
Interest Rate
6.75%
Estimated Equity
$1,215,764
Purchase Details
Closed on
Nov 14, 1996
Sold by
Smith Patricia
Bought by
Smith Manfred Jack
Home Financials for this Owner
Home Financials are based on the most recent Mortgage that was taken out on this home.
Original Mortgage
$56,671
Interest Rate
7.53%
Create a Home Valuation Report for This Property
The Home Valuation Report is an in-depth analysis detailing your home's value as well as a comparison with similar homes in the area
Home Values in the Area
Average Home Value in this Area
Purchase History
| Date | Buyer | Sale Price | Title Company |
|---|---|---|---|
| Goodman Jason | -- | None Available | |
| Goodman Jason | $255,000 | Fidelity National Title | |
| Smith Manfred Jack | -- | Stewart Title |
Source: Public Records
Mortgage History
| Date | Status | Borrower | Loan Amount |
|---|---|---|---|
| Open | Goodman Jason | $204,000 | |
| Previous Owner | Smith Manfred Jack | $56,671 |
Source: Public Records
Tax History Compared to Growth
Tax History
| Year | Tax Paid | Tax Assessment Tax Assessment Total Assessment is a certain percentage of the fair market value that is determined by local assessors to be the total taxable value of land and additions on the property. | Land | Improvement |
|---|---|---|---|---|
| 2025 | $4,285 | $399,772 | $141,096 | $258,676 |
| 2024 | $4,285 | $391,933 | $138,329 | $253,604 |
| 2023 | $4,219 | $384,248 | $135,617 | $248,631 |
| 2022 | $4,126 | $376,714 | $132,958 | $243,756 |
| 2021 | $4,119 | $369,327 | $130,351 | $238,976 |
| 2020 | $4,007 | $365,540 | $129,014 | $236,526 |
| 2019 | $3,992 | $358,372 | $126,484 | $231,888 |
| 2018 | $3,895 | $351,345 | $124,004 | $227,341 |
| 2017 | $3,781 | $344,456 | $121,573 | $222,883 |
| 2016 | $3,576 | $337,702 | $119,189 | $218,513 |
| 2015 | $3,494 | $332,630 | $117,399 | $215,231 |
| 2014 | $3,398 | $326,114 | $115,099 | $211,015 |
Source: Public Records
Map
Nearby Homes
- 2304 Rosedale Curve
- 2335 N San Antonio Ave
- 860 Emerson St
- 937 Emerson St
- 701 W 24th St
- 2350 Sunset Curve
- 2445 Ocean View Dr
- 0 Vista Dr
- 785 W Dalton Ct
- 1230 Piedmont Dr
- 1252 Granada St
- 2252 Verbena Ave
- 211 Deborah Ct
- 2166 Malati Cir
- 666 W 21st St
- 907 Pineridge St
- 2279 Wisteria Ave
- 2163 Pinot Cir
- 2241 N 1st Ave
- 475 W 26th St
- 2390 Park Blvd
- 2349 Paloma Curve
- 2350 Paloma Curve
- 2386 Park Blvd
- 2354 Paloma Curve
- 2348 Paloma Curve
- 2354 Park Blvd
- 2391 Park Blvd
- 2393 Park Blvd
- 2364 Paloma Curve
- 2352 Paloma Curve
- 2385 Park Blvd
- 2325 Ravina Curve
- 2395 Park Blvd
- 2346 Paloma Curve
- 2352 Park Blvd
- 2374 Paloma Curve
- 2375 Park Blvd
- 2342 Paloma Curve
- 2324 Rosedale Curve