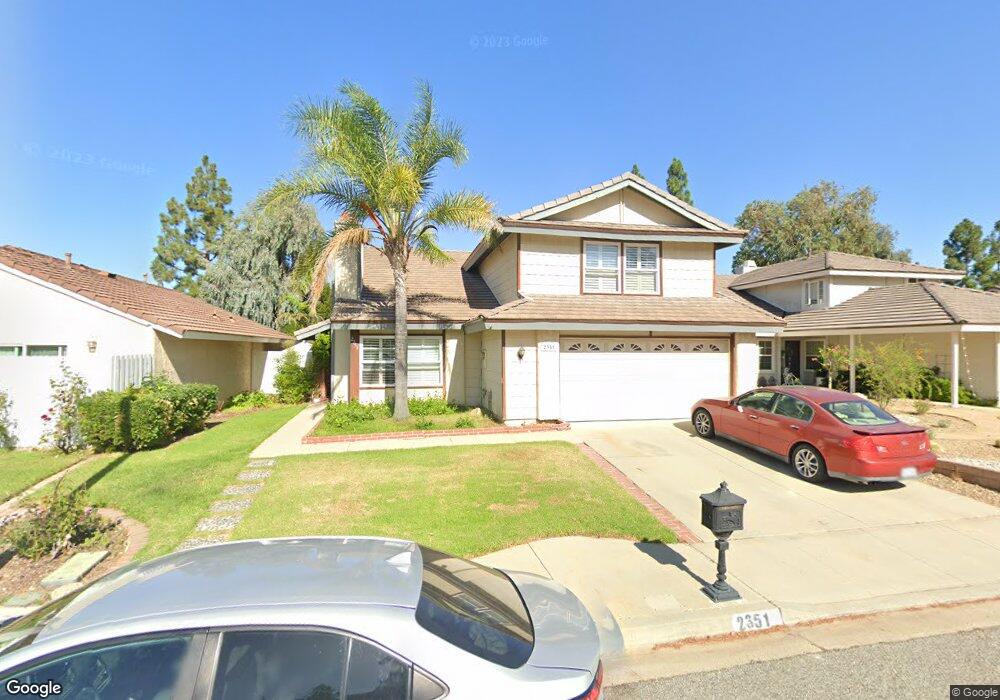
2351 Yew Dr Newbury Park, CA 91320
Estimated Value: $989,000 - $1,204,000
4
Beds
3
Baths
2,090
Sq Ft
$501/Sq Ft
Est. Value
About This Home
This home is located at 2351 Yew Dr, Newbury Park, CA 91320 and is currently estimated at $1,046,503, approximately $500 per square foot. 2351 Yew Dr is a home located in Ventura County with nearby schools including Banyan Elementary School, Sequoia Middle School, and Newbury Park High School.
Ownership History
Date
Name
Owned For
Owner Type
Purchase Details
Closed on
Apr 30, 2001
Sold by
White Hugh Kevin and White Karen M
Bought by
Green James J and Green Susan T
Current Estimated Value
Home Financials for this Owner
Home Financials are based on the most recent Mortgage that was taken out on this home.
Original Mortgage
$260,000
Outstanding Balance
$97,299
Interest Rate
7.06%
Estimated Equity
$949,204
Purchase Details
Closed on
May 17, 1996
Sold by
Ford Consumer Finance Company Inc
Bought by
White Hugh Kevin and White Karen M
Home Financials for this Owner
Home Financials are based on the most recent Mortgage that was taken out on this home.
Original Mortgage
$213,180
Interest Rate
7.96%
Purchase Details
Closed on
Feb 24, 1996
Sold by
Karpel Kenneth and Karpel Joyce
Bought by
Ford Consumer Finance Company Inc
Create a Home Valuation Report for This Property
The Home Valuation Report is an in-depth analysis detailing your home's value as well as a comparison with similar homes in the area
Home Values in the Area
Average Home Value in this Area
Purchase History
| Date | Buyer | Sale Price | Title Company |
|---|---|---|---|
| Green James J | $333,000 | Fidelity National Title | |
| White Hugh Kevin | $220,000 | American Title Ins Co | |
| Ford Consumer Finance Company Inc | $249,900 | Stewart Title |
Source: Public Records
Mortgage History
| Date | Status | Borrower | Loan Amount |
|---|---|---|---|
| Open | Green James J | $260,000 | |
| Previous Owner | White Hugh Kevin | $213,180 |
Source: Public Records
Tax History Compared to Growth
Tax History
| Year | Tax Paid | Tax Assessment Tax Assessment Total Assessment is a certain percentage of the fair market value that is determined by local assessors to be the total taxable value of land and additions on the property. | Land | Improvement |
|---|---|---|---|---|
| 2025 | $5,624 | $501,750 | $200,697 | $301,053 |
| 2024 | $5,624 | $491,912 | $196,762 | $295,150 |
| 2023 | $5,451 | $482,267 | $192,904 | $289,363 |
| 2022 | $5,353 | $472,811 | $189,121 | $283,690 |
| 2021 | $5,259 | $463,541 | $185,413 | $278,128 |
| 2020 | $4,836 | $458,790 | $183,513 | $275,277 |
| 2019 | $4,707 | $449,795 | $179,915 | $269,880 |
| 2018 | $4,612 | $440,977 | $176,388 | $264,589 |
| 2017 | $4,522 | $432,331 | $172,930 | $259,401 |
| 2016 | $4,479 | $423,855 | $169,540 | $254,315 |
| 2015 | $4,400 | $417,491 | $166,995 | $250,496 |
| 2014 | $4,336 | $409,315 | $163,725 | $245,590 |
Source: Public Records
Map
Nearby Homes
- 2742 Borchard Rd Unit 207
- 1930 Adrian St
- 190 Donegal Ave
- 5 S Beatty Place
- 251 Asta Ct
- 560 Randy Dr
- 2775 Edgeview Ct
- 187 Silas Ave
- 1667 Calle Zafiro Unit 4
- 628 Paseo la Perla
- 1689 Amador Ln
- 602 Avenida Del Platino
- 538 Dorena Dr
- 639 Avenida Del Platino
- 16 Robertson Way
- 585 N Wendy Dr
- 3305 Henry Dr
- 1325 Ashton Park Ln
- 476 Jeanne Ct
- 1315 Ramona Dr