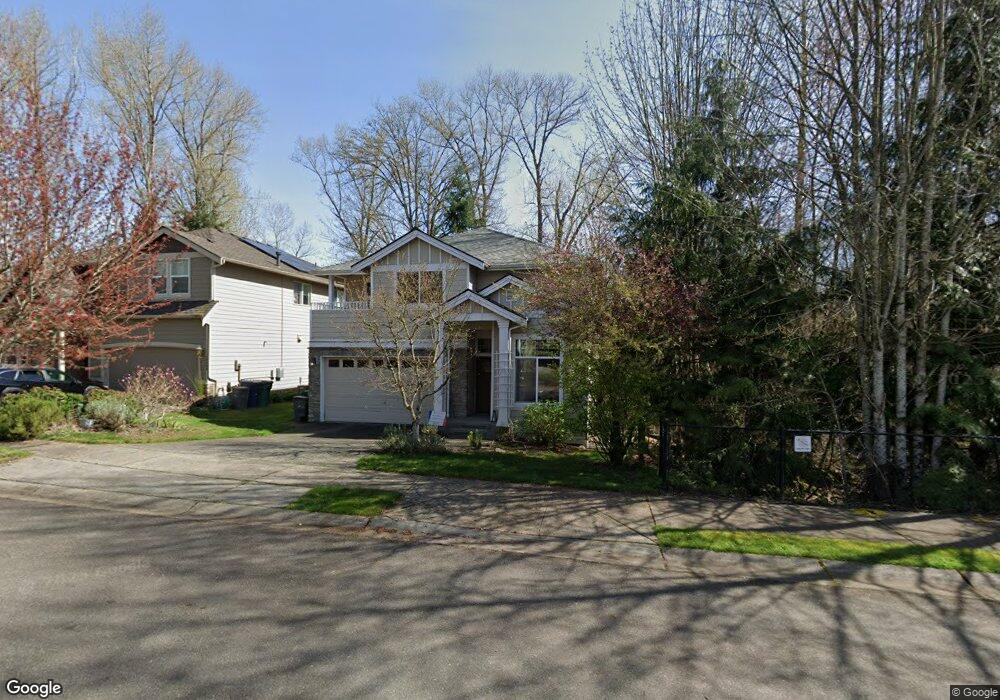
23513 17th Ave W Unit Lt 60 Bothell, WA 98021
Queensborough-Brentwood NeighborhoodEstimated Value: $1,139,000 - $1,431,000
4
Beds
3
Baths
2,877
Sq Ft
$435/Sq Ft
Est. Value
About This Home
This home is located at 23513 17th Ave W Unit Lt 60, Bothell, WA 98021 and is currently estimated at $1,251,734, approximately $435 per square foot. 23513 17th Ave W Unit Lt 60 is a home located in Snohomish County with nearby schools including Lockwood Elementary School, Kenmore Middle School, and Bothell High School.
Ownership History
Date
Name
Owned For
Owner Type
Purchase Details
Closed on
Mar 5, 2015
Sold by
Browning Neal D and Browning Teri L
Bought by
Dumaine Ludovic and Declerck Aurelie
Current Estimated Value
Home Financials for this Owner
Home Financials are based on the most recent Mortgage that was taken out on this home.
Original Mortgage
$260,000
Outstanding Balance
$195,075
Interest Rate
3.61%
Mortgage Type
New Conventional
Estimated Equity
$1,056,659
Purchase Details
Closed on
Feb 24, 2006
Sold by
Scharbach Construction Llc
Bought by
Browning Neil D and Lind Teri L
Home Financials for this Owner
Home Financials are based on the most recent Mortgage that was taken out on this home.
Original Mortgage
$86,800
Interest Rate
6.08%
Mortgage Type
Credit Line Revolving
Create a Home Valuation Report for This Property
The Home Valuation Report is an in-depth analysis detailing your home's value as well as a comparison with similar homes in the area
Home Values in the Area
Average Home Value in this Area
Purchase History
| Date | Buyer | Sale Price | Title Company |
|---|---|---|---|
| Dumaine Ludovic | $555,000 | Chicago Title | |
| Browning Neil D | $502,000 | Chicago |
Source: Public Records
Mortgage History
| Date | Status | Borrower | Loan Amount |
|---|---|---|---|
| Open | Dumaine Ludovic | $260,000 | |
| Previous Owner | Browning Neil D | $86,800 | |
| Previous Owner | Browning Neil D | $365,000 |
Source: Public Records
Tax History
| Year | Tax Paid | Tax Assessment Tax Assessment Total Assessment is a certain percentage of the fair market value that is determined by local assessors to be the total taxable value of land and additions on the property. | Land | Improvement |
|---|---|---|---|---|
| 2026 | $8,609 | $1,241,500 | $763,200 | $478,300 |
| 2025 | $8,454 | $1,017,000 | $551,200 | $465,800 |
| 2024 | $8,454 | $1,006,100 | $556,500 | $449,600 |
| 2023 | $9,049 | $1,173,600 | $640,500 | $533,100 |
| 2022 | $8,545 | $887,300 | $429,500 | $457,800 |
| 2020 | $7,416 | $715,600 | $328,000 | $387,600 |
| 2019 | $7,062 | $698,700 | $265,000 | $433,700 |
| 2018 | $6,244 | $581,800 | $230,000 | $351,800 |
| 2017 | $5,290 | $505,900 | $175,000 | $330,900 |
| 2016 | $5,096 | $472,000 | $155,000 | $317,000 |
| 2015 | $4,762 | $414,600 | $139,000 | $275,600 |
| 2013 | $4,545 | $344,200 | $127,000 | $217,200 |
Source: Public Records
Map
Nearby Homes
- 23716 Locust Way
- 23520 20th Ave W
- 23518 20th Ave W
- 23708 Locust Way Unit 23
- 23815 22nd Ave W
- 23728 Vista View Ave
- 1017 236th Place SW
- 1900 240th Place SW
- 931 236th Place SW
- 24013 22nd Ave W
- 23812 Lake Dr E
- 22827 20th Place W
- 24223 13th Place W
- 1313 228th Place SW
- 24115 22nd Place W
- 1425 243rd Place SW
- 1520 243rd Place SW Unit B
- 1121 244th St SW Unit 66
- 2128 229th Place SW
- 1528 243rd Place SW Unit A
- 23513 17th Ave W
- 23509 17th Ave W
- 23509 17th Ave W Unit Lt 61
- 1701 235th Place SW
- 1705 235th Place SW
- 1705 235th Place SW Unit Lt 63
- 1700 235th Place SW
- 1704 235th Place SW
- 1704 235th Place SW Unit Lt 72
- 1709 235th Place SW
- 1709 235th Place SW Unit Lt 64
- 23602 17th Ave W
- 1708 235th Place SW
- 1713 235th Place SW
- 1713 235th Place SW Unit Lt 65
- 1712 235th Place SW
- 23605 17th Ave W
- 23605 17th Ave W
- 23603 17th Place W
- 23606 17th Ave W
Your Personal Tour Guide
Ask me questions while you tour the home.