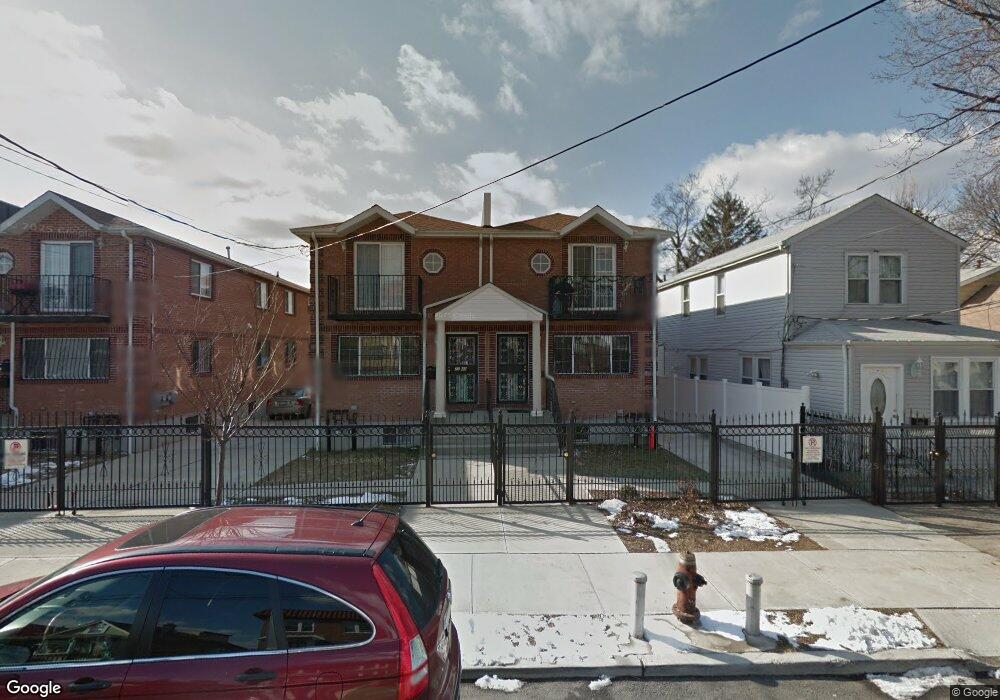
2352 91st St Flushing, NY 11369
Jackson Heights NeighborhoodEstimated Value: $1,098,000 - $1,327,184
Studio
--
Bath
2,148
Sq Ft
$576/Sq Ft
Est. Value
About This Home
This home is located at 2352 91st St, Flushing, NY 11369 and is currently estimated at $1,237,046, approximately $575 per square foot. 2352 91st St is a home located in Queens County with nearby schools including P.S. 127 Aerospace Science Magnet School, I.S. 145 Joseph Pulitzer Magnet School, and William Cullen Bryant High School.
Ownership History
Date
Name
Owned For
Owner Type
Purchase Details
Closed on
Feb 11, 2022
Sold by
Restrepo Diana
Bought by
91St Street Holdings Llc
Current Estimated Value
Purchase Details
Closed on
Feb 27, 2017
Sold by
Restrepo Diana P and Vargas Ulises R
Bought by
Restrepo Diana P
Purchase Details
Closed on
Nov 29, 2016
Sold by
Eng Frances G and Eng Christine
Bought by
Restrepo Diana P and Vargas Ulises R
Purchase Details
Closed on
Oct 24, 2012
Sold by
Eng Christine and Eng Hang Chee
Bought by
Eng Christine and Eng Frances G
Purchase Details
Closed on
Oct 29, 2010
Sold by
Titanium Towers Management Corp
Bought by
Eng Christine and Eng Hang Chee
Home Financials for this Owner
Home Financials are based on the most recent Mortgage that was taken out on this home.
Original Mortgage
$480,000
Interest Rate
4.35%
Mortgage Type
Purchase Money Mortgage
Create a Home Valuation Report for This Property
The Home Valuation Report is an in-depth analysis detailing your home's value as well as a comparison with similar homes in the area
Home Values in the Area
Average Home Value in this Area
Purchase History
| Date | Buyer | Sale Price | Title Company |
|---|---|---|---|
| 91St Street Holdings Llc | -- | -- | |
| 91St Street Holdings Llc | -- | -- | |
| Restrepo Diana P | -- | -- | |
| Restrepo Diana P | -- | -- | |
| Restrepo Diana P | $900,000 | -- | |
| Restrepo Diana P | $900,000 | -- | |
| Eng Christine | -- | -- | |
| Eng Christine | -- | -- | |
| Eng Christine | $677,136 | -- |
Source: Public Records
Mortgage History
| Date | Status | Borrower | Loan Amount |
|---|---|---|---|
| Previous Owner | Eng Christine | $480,000 |
Source: Public Records
Tax History
| Year | Tax Paid | Tax Assessment Tax Assessment Total Assessment is a certain percentage of the fair market value that is determined by local assessors to be the total taxable value of land and additions on the property. | Land | Improvement |
|---|---|---|---|---|
| 2025 | $7,764 | $38,950 | $6,718 | $32,232 |
| 2024 | $7,764 | $38,654 | $7,044 | $31,610 |
| 2023 | $7,325 | $36,468 | $6,279 | $30,189 |
| 2022 | $6,868 | $65,940 | $12,180 | $53,760 |
| 2021 | $6,831 | $64,560 | $12,180 | $52,380 |
| 2020 | $6,870 | $70,980 | $12,180 | $58,800 |
| 2019 | $6,738 | $60,780 | $12,180 | $48,600 |
| 2018 | $5,844 | $30,390 | $8,652 | $21,738 |
| 2017 | $5,844 | $28,670 | $7,212 | $21,458 |
| 2016 | $5,407 | $28,670 | $7,212 | $21,458 |
Source: Public Records
Map
Nearby Homes
Your Personal Tour Guide
Ask me questions while you tour the home.