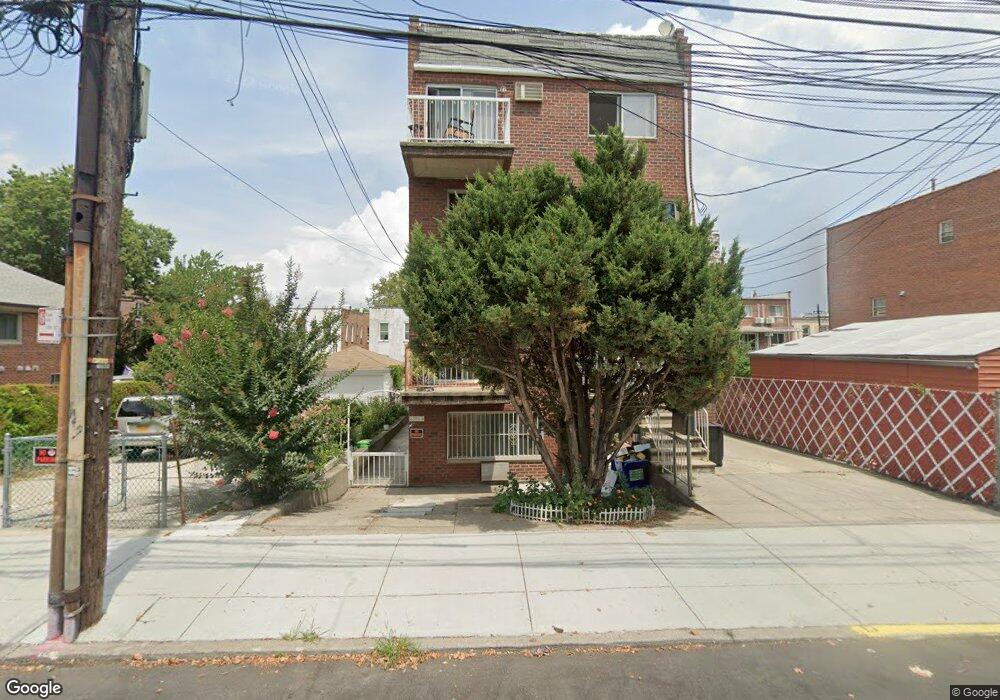
2353 Boynton Place Unit G Brooklyn, NY 11223
Gravesend NeighborhoodEstimated Value: $531,000 - $620,000
--
Bed
--
Bath
912
Sq Ft
$631/Sq Ft
Est. Value
About This Home
This home is located at 2353 Boynton Place Unit G, Brooklyn, NY 11223 and is currently estimated at $575,308, approximately $630 per square foot. 2353 Boynton Place Unit G is a home located in Kings County with nearby schools including P.S. 95 - The Gravesend, Is 228 David A Boody, and Big Apple Academy.
Ownership History
Date
Name
Owned For
Owner Type
Purchase Details
Closed on
Mar 13, 2017
Sold by
The Alex Bogari And Lyudmila Bogari Jnt
Bought by
Li Fengmei and Zhang Jia Ying
Current Estimated Value
Home Financials for this Owner
Home Financials are based on the most recent Mortgage that was taken out on this home.
Original Mortgage
$260,000
Outstanding Balance
$215,606
Interest Rate
4.17%
Mortgage Type
Purchase Money Mortgage
Estimated Equity
$359,702
Purchase Details
Closed on
Aug 7, 2009
Sold by
Bogari Alex
Bought by
Bogari Trustee Alex and Bogari,Trustee, Lyudmila
Purchase Details
Closed on
Feb 14, 2006
Sold by
Galiev Farit
Bought by
Bogari Alex and Bogari Lyudmila
Home Financials for this Owner
Home Financials are based on the most recent Mortgage that was taken out on this home.
Original Mortgage
$220,950
Interest Rate
6.55%
Mortgage Type
Purchase Money Mortgage
Create a Home Valuation Report for This Property
The Home Valuation Report is an in-depth analysis detailing your home's value as well as a comparison with similar homes in the area
Home Values in the Area
Average Home Value in this Area
Purchase History
| Date | Buyer | Sale Price | Title Company |
|---|---|---|---|
| Li Fengmei | $415,000 | -- | |
| Bogari Trustee Alex | -- | -- | |
| Bogari Alex | $290,000 | -- |
Source: Public Records
Mortgage History
| Date | Status | Borrower | Loan Amount |
|---|---|---|---|
| Open | Li Fengmei | $260,000 | |
| Previous Owner | Bogari Alex | $220,950 |
Source: Public Records
Tax History Compared to Growth
Tax History
| Year | Tax Paid | Tax Assessment Tax Assessment Total Assessment is a certain percentage of the fair market value that is determined by local assessors to be the total taxable value of land and additions on the property. | Land | Improvement |
|---|---|---|---|---|
| 2025 | $3,108 | $144,541 | $10,688 | $133,853 |
| 2024 | $3,108 | $120,635 | $10,688 | $109,947 |
| 2023 | $2,031 | $115,998 | $10,688 | $105,310 |
| 2022 | $2,025 | $114,040 | $10,688 | $103,352 |
| 2021 | $1,967 | $102,808 | $10,688 | $92,120 |
| 2020 | $896 | $108,063 | $10,688 | $97,375 |
| 2019 | $1,734 | $108,063 | $10,688 | $97,375 |
| 2018 | $2,252 | $17,709 | $2,051 | $15,658 |
| 2017 | $2,033 | $17,709 | $1,948 | $15,761 |
| 2016 | $1,908 | $17,159 | $1,794 | $15,365 |
| 2015 | $1,004 | $15,888 | $1,331 | $14,557 |
| 2014 | $1,004 | $14,712 | $993 | $13,719 |
Source: Public Records
Map
Nearby Homes
- 2301 W 7th St
- 2265 W 7th St Unit 2A
- 2265 W 7th St Unit 2B
- 2267 W 6th St
- 2253 W 6th St
- 472 Lake St
- 458 Van Sicklen St
- 2237 W 6th St
- 2222 W 7th St
- 2233 W 5th St
- 2416 McDonald Ave
- 2177 W 7th St
- 2319 W 12th St
- 2349 W 12th St
- 125 Stryker St
- 76 Lake Place
- 2154 W 6th St
- 60 Lake Place
- 9 Corso Ct
- 2140 W 6th St
- 2353 Boynton Place Unit 2
- 2353 Boynton Place Unit 1
- 2353 Boynton Place
- 2363 Boynton Place
- 2345 Boynton Place
- 2365 Boynton Place
- 2367 Boynton Place
- 2882 86th St
- 2886 86th St
- 2341 Boynton Place
- 2904 86th St
- 2369 Boynton Place
- 2906 86th St
- 2346 Boynton Place
- 2874 86th St
- 2874 86th St Unit 2
- 2371 Boynton Place
- 2892 86th St
- 2880 86th St
- 2878 86th St