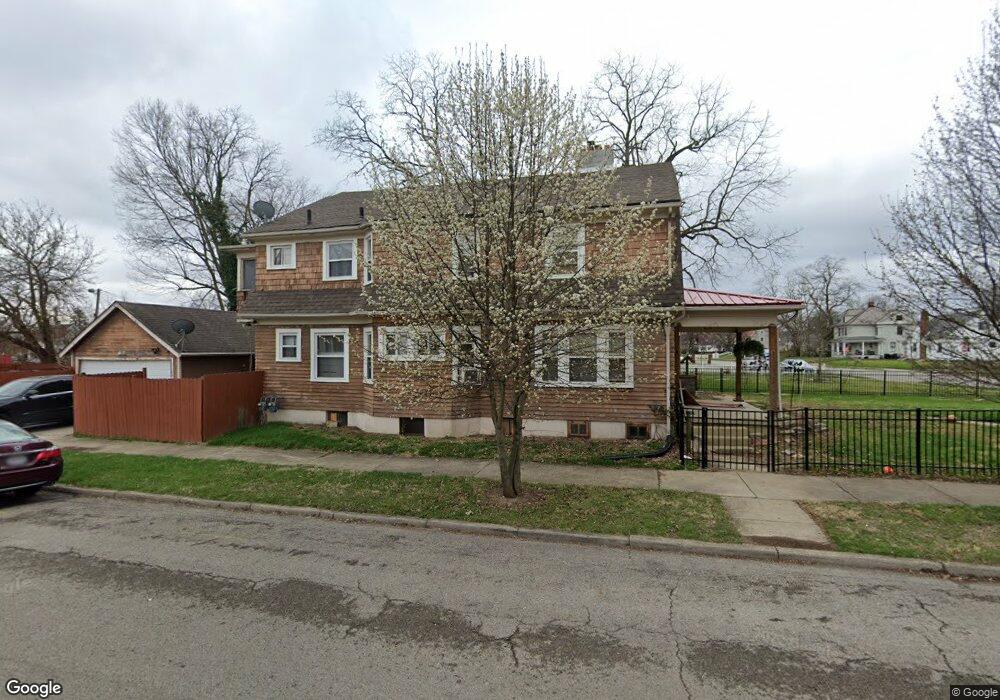
2353 E High St Unit 2355 Springfield, OH 45505
Estimated Value: $171,198 - $199,000
6
Beds
2
Baths
3,148
Sq Ft
$59/Sq Ft
Est. Value
About This Home
This home is located at 2353 E High St Unit 2355, Springfield, OH 45505 and is currently estimated at $185,050, approximately $58 per square foot. 2353 E High St Unit 2355 is a home located in Clark County with nearby schools including Mann Elementary School, Schaefer Middle School, and Springfield High School.
Ownership History
Date
Name
Owned For
Owner Type
Purchase Details
Closed on
Oct 30, 2007
Sold by
Maddox William Richard and Maddox Diana M
Bought by
Gullett Amy S
Current Estimated Value
Home Financials for this Owner
Home Financials are based on the most recent Mortgage that was taken out on this home.
Original Mortgage
$94,016
Outstanding Balance
$58,669
Interest Rate
6.38%
Mortgage Type
FHA
Estimated Equity
$126,381
Purchase Details
Closed on
Apr 23, 2004
Sold by
Gordon Bruce B and Gordon Tina D
Bought by
Maddox William Richard
Home Financials for this Owner
Home Financials are based on the most recent Mortgage that was taken out on this home.
Original Mortgage
$68,400
Interest Rate
6.17%
Mortgage Type
Purchase Money Mortgage
Purchase Details
Closed on
Nov 26, 1991
Create a Home Valuation Report for This Property
The Home Valuation Report is an in-depth analysis detailing your home's value as well as a comparison with similar homes in the area
Home Values in the Area
Average Home Value in this Area
Purchase History
| Date | Buyer | Sale Price | Title Company |
|---|---|---|---|
| Gullett Amy S | $94,800 | Ohio Real Estate Title | |
| Maddox William Richard | $75,000 | First American Title Insuran | |
| -- | $65,000 | -- |
Source: Public Records
Mortgage History
| Date | Status | Borrower | Loan Amount |
|---|---|---|---|
| Open | Gullett Amy S | $94,016 | |
| Previous Owner | Maddox William Richard | $68,400 |
Source: Public Records
Tax History
| Year | Tax Paid | Tax Assessment Tax Assessment Total Assessment is a certain percentage of the fair market value that is determined by local assessors to be the total taxable value of land and additions on the property. | Land | Improvement |
|---|---|---|---|---|
| 2025 | $2,228 | $57,210 | $7,230 | $49,980 |
| 2024 | $2,170 | $45,020 | $6,660 | $38,360 |
| 2023 | $2,170 | $45,020 | $6,660 | $38,360 |
| 2022 | $2,222 | $45,020 | $6,660 | $38,360 |
| 2021 | $1,878 | $35,130 | $5,170 | $29,960 |
| 2020 | $1,883 | $35,130 | $5,170 | $29,960 |
| 2019 | $1,887 | $35,130 | $5,170 | $29,960 |
| 2018 | $1,842 | $32,940 | $5,870 | $27,070 |
| 2017 | $1,841 | $32,939 | $5,873 | $27,066 |
| 2016 | $1,843 | $32,939 | $5,873 | $27,066 |
| 2015 | $2,008 | $35,203 | $5,873 | $29,330 |
| 2014 | $2,000 | $35,203 | $5,873 | $29,330 |
| 2013 | $1,979 | $35,203 | $5,873 | $29,330 |
Source: Public Records
Map
Nearby Homes
- 2425 Kenilworth Ave
- 115 S Burnett Rd
- 250 S Douglas Ave Unit 254
- 360 Buxton Ave
- 374 Raffensperger Ave
- 129 N Burnett Rd
- 26 N Belmont Ave
- 2702 Maplewood Ave
- 2730 E Main St
- 2338 Dellwood Dr
- 1664 Warder St
- 1721 Prospect St
- 1621 Morgan St
- 2201 Woodside Ave
- 1585 Mound St
- 2804 Lowman St
- 375 N Fostoria Ave
- 1569-1571 Mound St
- 138 Lawnview Ave
- 2409 Mayfair Dr
- 2349 E High St
- 2345 E High St
- 2415 E High St Unit 2417
- 2415 E High St
- 228 Raffensperger Ave
- 2412 E High St Unit 2414
- 2400 E High St
- 2408 E High St Unit 2410
- 232 Raffensperger Ave
- 2418 E High St
- 234 Raffensperger Ave
- 38 Oakland Ct
- 2350 E High St
- 37 Oakland Ct
- 32 Oakland Ct
- 2315 E High St
- 244 Raffensperger Ave
- 247 Raffensperger Ave
- 2427 E High St
- 33 Oakland Ct
Your Personal Tour Guide
Ask me questions while you tour the home.