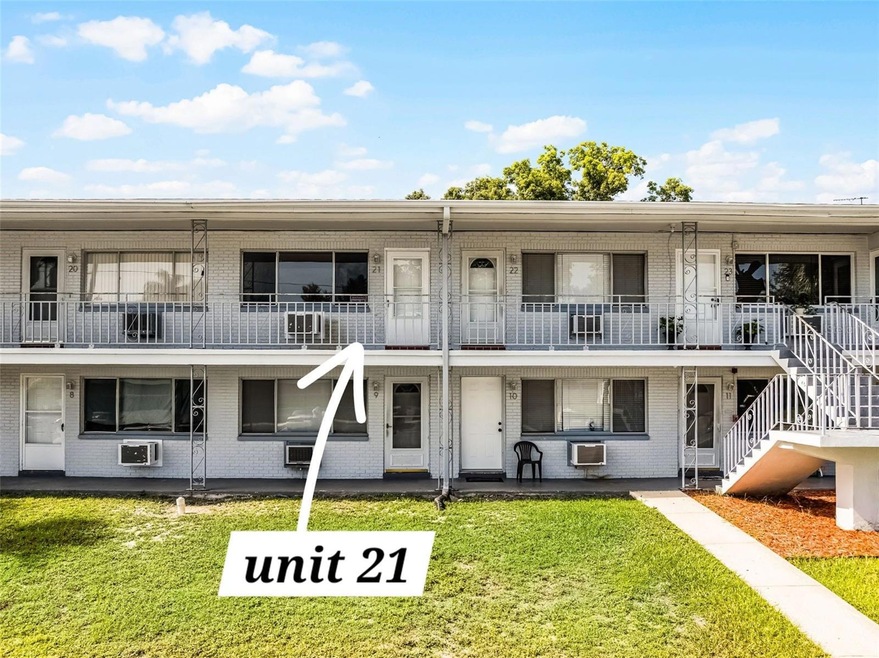
2353 Shelley St Unit 21 Clearwater, FL 33765
Estimated payment $1,298/month
Highlights
- Great Room
- Ceramic Tile Flooring
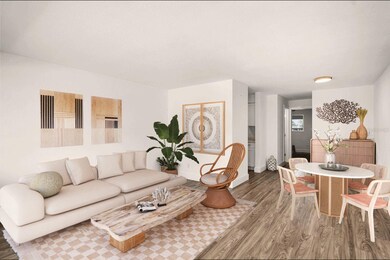
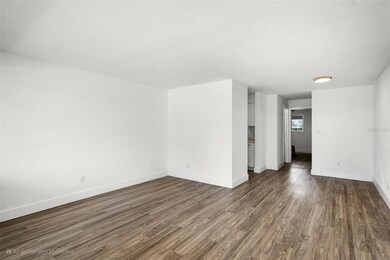
- Combination Dining and Living Room
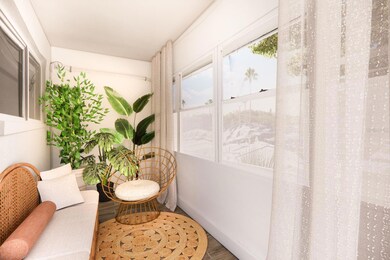
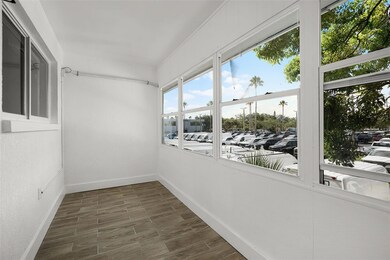
- Balcony
- Central Heating
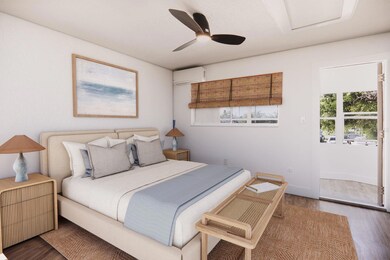
- Ceiling Fan
About This Home
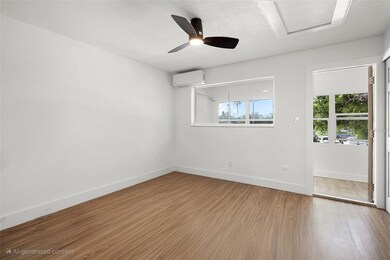
One or more photo(s) has been virtually staged. This fully renovated one-bedroom, one-bath condo is the perfect lock-and-leave retreat in the heart of Clearwater—just three minutes from St. Petersburg College’s Clearwater Campus. Whether you're seeking a seasonal escape, part-time Florida home, or a flexible-use investment, this property checks every box. Ideal for snowbirds, weekend getaways, or buyers looking to own a second home near the coast, this unit offers short-term rental, long-term lease, or primary residence options—giving you the freedom to enjoy it personally or generate income when you're away. Similar units in the building are currently renting for over fifteen hundred dollars monthly, making this a smart choice for both personal use and investment. You’re just fifteen minutes from the award-winning sands of Clearwater Beach, twenty minutes to Tampa International Airport, twenty-five minutes to downtown St. Petersburg, and ten minutes to downtown Clearwater. Plus, everything you need is right around the corner—grocery stores, restaurants, coffee shops, gyms, and retail centers are all just three to five minutes away. There are additional units available for sale in the same building, currently rented and generating approximately 7 in ROI. If you're considering expanding your portfolio or want to explore multi-unit ownership, ask me for more details.
This move-in-ready condo offers a rare blend of convenience, comfort, and coastal living—perfect for your next chapter in Florida.
Listing Agent
EXP REALTY LLC Brokerage Phone: 407-476-4127 License #3437380 Listed on: 07/24/2025

Property Details
Home Type
- Condominium
Est. Annual Taxes
- $1,628
Year Built
- Built in 1966
HOA Fees
- $360 Monthly HOA Fees
Home Design
- Entry on the 2nd floor
- Shingle Roof
- Block Exterior
Interior Spaces
- 585 Sq Ft Home
- 1-Story Property
- Ceiling Fan
- Great Room
- Combination Dining and Living Room
- Range
Flooring
- Ceramic Tile
- Vinyl
Bedrooms and Bathrooms
- 1 Bedroom
- 1 Full Bathroom
Schools
- Eisenhower Elementary School
- Oak Grove Middle School
- Clearwater High School
Utilities
- Mini Split Air Conditioners
- Cooling System Mounted To A Wall/Window
- Central Heating
Additional Features
- Balcony
- North Facing Home
Listing and Financial Details
- Visit Down Payment Resource Website
- Legal Lot and Block 21 / 80568
- Assessor Parcel Number 18-29-16-80568-000-0210
Community Details
Overview
- Association fees include escrow reserves fund, insurance, maintenance structure, ground maintenance, water
- Shelley Gardens 2 Condo Subdivision
Amenities
- Community Mailbox
Pet Policy
- Pets Allowed
- Pets up to 125 lbs
Map
Tax History
| Year | Tax Paid | Tax Assessment Tax Assessment Total Assessment is a certain percentage of the fair market value that is determined by local assessors to be the total taxable value of land and additions on the property. | Land | Improvement |
|---|---|---|---|---|
| 2025 | $1,628 | $95,999 | -- | $95,999 |
| 2024 | $1,016 | $85,919 | -- | $85,919 |
| 2023 | $1,016 | $84,487 | $0 | $84,487 |
| 2022 | $791 | $53,683 | $0 | $53,683 |
| 2021 | $729 | $44,737 | $0 | $0 |
| 2020 | $655 | $38,025 | $0 | $0 |
| 2019 | $592 | $33,230 | $0 | $33,230 |
| 2018 | $532 | $28,483 | $0 | $0 |
| 2017 | $445 | $21,784 | $0 | $0 |
| 2016 | $431 | $23,206 | $0 | $0 |
| 2015 | $375 | $17,702 | $0 | $0 |
| 2014 | $381 | $17,919 | $0 | $0 |
Property History
| Date | Event | Price | List to Sale | Price per Sq Ft |
|---|---|---|---|---|
| 02/18/2026 02/18/26 | For Sale | $156,000 | 0.0% | $267 / Sq Ft |
| 01/26/2026 01/26/26 | For Sale | $156,000 | 0.0% | $267 / Sq Ft |
| 01/23/2026 01/23/26 | Off Market | $156,000 | -- | -- |
| 07/25/2025 07/25/25 | Pending | -- | -- | -- |
| 07/24/2025 07/24/25 | For Sale | $156,000 | -- | $267 / Sq Ft |
Purchase History
| Date | Type | Sale Price | Title Company |
|---|---|---|---|
| Quit Claim Deed | -- | None Available | |
| Deed | $100 | -- | |
| Warranty Deed | $22,500 | Fidelity National Title Of F | |
| Interfamily Deed Transfer | -- | -- | |
| Warranty Deed | $35,000 | Pioneer Title Inc | |
| Deed | $21,000 | -- | |
| Warranty Deed | -- | -- | |
| Warranty Deed | $22,200 | -- |
Mortgage History
| Date | Status | Loan Amount | Loan Type |
|---|---|---|---|
| Previous Owner | $30,368 | New Conventional |
Source: Stellar MLS
MLS Number: O6329612
APN: 18-29-16-80568-000-0210
Disclaimer: Certain information contained herein is derived from information provided by parties other than Homes.com. All information provided is deemed reliable, but is not guaranteed to be accurate and should be independently verified.
![]() Based on information submitted to the MLS GRID. All data is obtained from various sources and may not have been verified by broker or MLS GRID. Supplied Open House Information is subject to change without notice. All information should be independently reviewed and verified for accuracy. Properties may or may not be listed by the office/agent presenting the information. Some IDX listings have been excluded from this website. IDX information is provided exclusively for personal, non-commercial use, and may not be used for any purpose other than to identify prospective properties consumers may be interested in purchasing. Information is deemed reliable but not guaranteed.
Based on information submitted to the MLS GRID. All data is obtained from various sources and may not have been verified by broker or MLS GRID. Supplied Open House Information is subject to change without notice. All information should be independently reviewed and verified for accuracy. Properties may or may not be listed by the office/agent presenting the information. Some IDX listings have been excluded from this website. IDX information is provided exclusively for personal, non-commercial use, and may not be used for any purpose other than to identify prospective properties consumers may be interested in purchasing. Information is deemed reliable but not guaranteed.
Based on information submitted to the MLS GRID
Listing Information presented by local MLS brokerage: Ten-X - (888)-952-6393
- 2353 Shelley St Unit 10
- 2353 Shelley St Unit 3
- 2353 Shelley St Unit 15
- 2348 Shelley St Unit 1
- 2348 Shelley St Unit 5
- 2324 Shelley St
- 2381 Gulf To Bay Blvd Unit 156
- 217 Evelyn Ave
- 2419 Gulf To Bay Blvd Unit 119
- 2419 Gulf To Bay Blvd Unit 374
- 2419 Gulf To Bay Blvd Unit 225
- 2419 Gulf To Bay Blvd Unit 1420
- 2419 Gulf To Bay Blvd Unit 1522
- 2419 Gulf To Bay Blvd Unit Lot 215
- 2419 Gulf To Bay Blvd Unit Lot 1214
- 2419 Gulf To Bay Blvd Unit 1314
- 2419 Gulf To Bay Blvd Unit 910
- 2419 Gulf To Bay Blvd Unit 1317
- 2419 Gulf To Bay Blvd Unit 219
- 2419 Gulf To Bay Blvd Unit 207
- 2353 Shelley St Unit 11
- 2366 Shelley St Unit 4
- 2346 Druid Rd E Unit 717
- 2346 Druid Rd E Unit 112
- 2346 Druid Rd E Unit 503
- 2346 Druid Rd E Unit 1003
- 2346 Druid Rd E Unit 1106
- 2484 Nash St
- 1001 Chinaberry Rd
- 200 S Starcrest Dr
- 2352 Lorena Ln
- 20000 US Highway 19 N Unit 610
- 20000 US Highway 19 N Unit 612
- 20000 US Highway 19 N Unit 607
- 411 S Nimbus Ave Unit 3
- 300 S Nimbus Ave Unit 9
- 2630 Pearce Dr Unit 208
- 2202 Curtis Dr N
- 1976 Drew Plaza
- 1320 Sands Terrace E
Ask me questions while you tour the home.