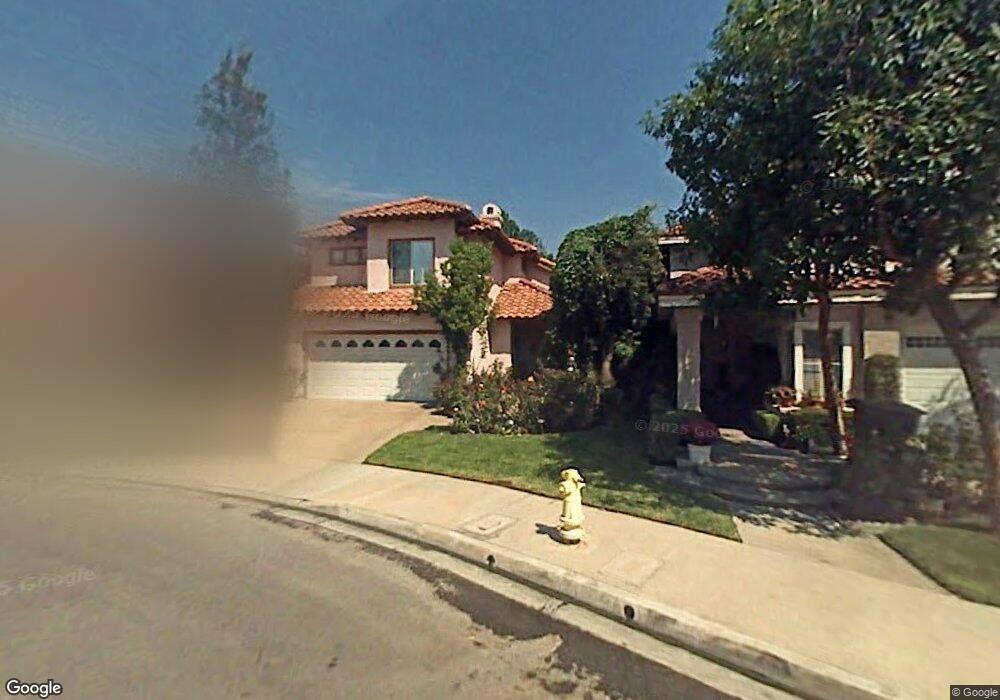
2354 Fullercreek Rd Chino Hills, CA 91709
North Chino Hills NeighborhoodEstimated Value: $953,720 - $1,092,000
4
Beds
3
Baths
1,722
Sq Ft
$595/Sq Ft
Est. Value
About This Home
This home is located at 2354 Fullercreek Rd, Chino Hills, CA 91709 and is currently estimated at $1,023,930, approximately $594 per square foot. 2354 Fullercreek Rd is a home located in San Bernardino County with nearby schools including Hidden Trails Elementary School, Canyon Hills Junior High School, and Ruben S. Ayala High School.
Ownership History
Date
Name
Owned For
Owner Type
Purchase Details
Closed on
Jun 1, 2000
Sold by
Thongnamsap Nara
Bought by
Lin Pi O and Chen Hung Sheng D
Current Estimated Value
Home Financials for this Owner
Home Financials are based on the most recent Mortgage that was taken out on this home.
Original Mortgage
$180,750
Interest Rate
8.19%
Purchase Details
Closed on
May 10, 1999
Sold by
Siripintu Sopon
Bought by
Thongnamsap Nara and Thongnamsap Churaisri
Purchase Details
Closed on
Mar 18, 1996
Sold by
Bancboston Mtg Corp
Bought by
Siripintu Sopon
Home Financials for this Owner
Home Financials are based on the most recent Mortgage that was taken out on this home.
Original Mortgage
$154,800
Interest Rate
6.98%
Purchase Details
Closed on
Nov 24, 1995
Sold by
Manns Roger W
Bought by
Bancboston Mtg
Create a Home Valuation Report for This Property
The Home Valuation Report is an in-depth analysis detailing your home's value as well as a comparison with similar homes in the area
Home Values in the Area
Average Home Value in this Area
Purchase History
| Date | Buyer | Sale Price | Title Company |
|---|---|---|---|
| Lin Pi O | $241,000 | Chicago Title | |
| Thongnamsap Nara | -- | -- | |
| Siripintu Sopon | $172,000 | First Southwestern Title Co | |
| Bancboston Mtg | -- | First Southwestern Title Co |
Source: Public Records
Mortgage History
| Date | Status | Borrower | Loan Amount |
|---|---|---|---|
| Previous Owner | Lin Pi O | $180,750 | |
| Previous Owner | Siripintu Sopon | $154,800 |
Source: Public Records
Tax History Compared to Growth
Tax History
| Year | Tax Paid | Tax Assessment Tax Assessment Total Assessment is a certain percentage of the fair market value that is determined by local assessors to be the total taxable value of land and additions on the property. | Land | Improvement |
|---|---|---|---|---|
| 2025 | $4,374 | $363,151 | $127,101 | $236,050 |
| 2024 | $4,374 | $356,031 | $124,609 | $231,422 |
| 2023 | $4,266 | $349,050 | $122,166 | $226,884 |
| 2022 | $4,242 | $342,206 | $119,771 | $222,435 |
| 2021 | $4,168 | $335,497 | $117,423 | $218,074 |
| 2020 | $4,120 | $332,057 | $116,219 | $215,838 |
| 2019 | $4,055 | $325,546 | $113,940 | $211,606 |
| 2018 | $3,976 | $319,163 | $111,706 | $207,457 |
| 2017 | $3,912 | $312,905 | $109,516 | $203,389 |
| 2016 | $3,687 | $306,770 | $107,369 | $199,401 |
| 2015 | $3,623 | $302,162 | $105,756 | $196,406 |
| 2014 | $4,114 | $296,243 | $103,684 | $192,559 |
Source: Public Records
Map
Nearby Homes
- 14726 Moon Crest Ln Unit E
- 2460 Windmill Creek Rd
- 14748 Moon Crest Ln Unit E
- 2432 Moon Dust Dr Unit B
- 2286 Black Pine Rd
- 2515 Pointe Coupee
- 2509 Moon Dust Dr Unit A
- 15075 Avenida Del Monte
- 15036 Calle la Paloma
- 14171 Shoreline Dr
- 1839 Nordic Ave
- 2024 Vista Del Sol
- 15085 Calle Verano
- 14155 Applegate Ln
- 3159 Morningfield Dr
- 3167 Morningfield Dr
- 3199 Morningfield Dr
- 15429 Turquoise Cir N
- 3027 Spyglass Ct
- 3056 Giant Forest Loop
- 2358 Fullercreek Rd
- 2350 Fullercreek Rd
- 2362 Fullercreek Rd
- 14572 Clearbrook Dr
- 2368 Fullercreek Rd
- 14580 Clearbrook Dr
- 2355 Fullercreek Rd
- 2374 Fullercreek Rd
- 14586 Clearbrook Dr
- 2361 Fullercreek Rd
- 2367 Fullercreek Rd
- 14524 Terrace Hill Ln
- 2380 Fullercreek Rd
- 14592 Clearbrook Dr
- 14518 Terrace Hill Ln
- 14530 Terrace Hill Ln
- 14512 Terrace Hill Ln
- 2373 Fullercreek Rd
- 14603 Clearbrook Dr
- 14536 Terrace Hill Ln Unit 4