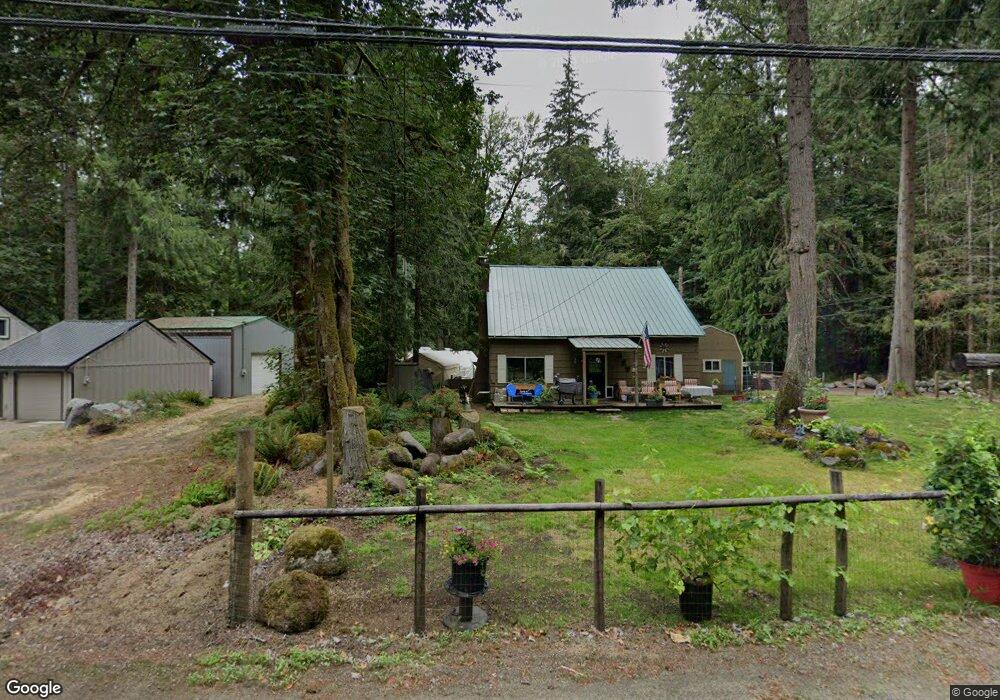
23547 E Lolo Pass Rd Rhododendron, OR 97049
Estimated Value: $387,000 - $548,000
2
Beds
1
Bath
1,215
Sq Ft
$379/Sq Ft
Est. Value
About This Home
This home is located at 23547 E Lolo Pass Rd, Rhododendron, OR 97049 and is currently estimated at $460,501, approximately $379 per square foot. 23547 E Lolo Pass Rd is a home located in Clackamas County with nearby schools including Welches Elementary School, Welches Middle School, and Sandy High School.
Ownership History
Date
Name
Owned For
Owner Type
Purchase Details
Closed on
Feb 2, 2022
Sold by
Gaslin Revocable Living Trust
Bought by
Gaslin Deborah Ann and Shoemaker Donald Scott
Current Estimated Value
Home Financials for this Owner
Home Financials are based on the most recent Mortgage that was taken out on this home.
Original Mortgage
$167,500
Outstanding Balance
$155,536
Interest Rate
3.55%
Mortgage Type
New Conventional
Estimated Equity
$304,965
Purchase Details
Closed on
Sep 4, 2019
Sold by
Gaslin Deborah
Bought by
Gaslin Deborah Ann and The Gaslin Revocable Living Tr
Purchase Details
Closed on
Jun 30, 2015
Sold by
Brazer Kenneth C
Bought by
Gaslin Deborah
Purchase Details
Closed on
Jun 8, 2001
Sold by
Bryan Eugene L and Bryan Elaine L
Bought by
Brazer Kenneth C
Home Financials for this Owner
Home Financials are based on the most recent Mortgage that was taken out on this home.
Original Mortgage
$120,000
Interest Rate
7.14%
Create a Home Valuation Report for This Property
The Home Valuation Report is an in-depth analysis detailing your home's value as well as a comparison with similar homes in the area
Home Values in the Area
Average Home Value in this Area
Purchase History
| Date | Buyer | Sale Price | Title Company |
|---|---|---|---|
| Gaslin Deborah Ann | -- | Wfg National Title | |
| Gaslin Deborah Ann | -- | None Available | |
| Gaslin Deborah | $192,000 | Ticor Title | |
| Brazer Kenneth C | $150,000 | First American |
Source: Public Records
Mortgage History
| Date | Status | Borrower | Loan Amount |
|---|---|---|---|
| Open | Gaslin Deborah Ann | $167,500 | |
| Previous Owner | Brazer Kenneth C | $120,000 |
Source: Public Records
Tax History Compared to Growth
Tax History
| Year | Tax Paid | Tax Assessment Tax Assessment Total Assessment is a certain percentage of the fair market value that is determined by local assessors to be the total taxable value of land and additions on the property. | Land | Improvement |
|---|---|---|---|---|
| 2024 | $2,658 | $183,902 | -- | -- |
| 2023 | $2,658 | $178,546 | $0 | $0 |
| 2022 | $2,524 | $173,346 | $0 | $0 |
| 2021 | $2,437 | $168,298 | $0 | $0 |
| 2020 | $2,374 | $163,397 | $0 | $0 |
| 2019 | $2,361 | $158,638 | $0 | $0 |
| 2018 | $2,258 | $154,017 | $0 | $0 |
| 2017 | $2,208 | $149,531 | $0 | $0 |
| 2016 | $2,132 | $145,176 | $0 | $0 |
| 2015 | $4,794 | $140,948 | $0 | $0 |
| 2014 | -- | $136,843 | $0 | $0 |
Source: Public Records
Map
Nearby Homes
- 23595 E Lolo Pass Rd
- 23400 E Bailey Rd
- 22505 E Lolo Pass Rd
- 69947 U S 26 Unit 1
- 71010 E Mcfarland Rd
- 70100 E Highway 26 Unit 5
- 69080 E Vine Maple Dr
- 68938 E Cedar Hill Loop
- 0 E Barlow Trail Rd Unit 690939939
- 0 E Barlow Trail Rd Unit 369670884
- 24120 E Farragut St
- 69070 E Fairway Ave
- 68323 E Twinberry Loop
- 23811 E John Paul Jones Ave
- 24201 E Evergreen Park St
- 25222 E Welches Rd Unit 12d
- 67930 E Stage Stop Rd
- 68154 E Twinberry Loop
- 25901 E Highview Dr
- 25482 E Cedar Glen Loop
- 23641 E Lolo Pass Rd
- 23561 E Lolo Pass Rd
- 23645 E Lolo Pass Rd
- 23649 E Lolo Pass Rd
- 23491 E Lolo Pass Rd
- 23655 E Lolo Pass Rd
- 70377 E Barlow Trail Rd
- 23735 E Lolo Pass Rd
- 23700 E Lolo Pass Rd
- 70302 E Barlow Trail Rd
- 23755 E Lolo Pass Rd
- 23755 E Lolo Pass Rd Unit 1
- 23749 E Lolo Pass Rd
- 23745 E Lolo Pass Rd
- 23560 E Lolo Pass Rd
- 23696 E Lolo Pass Rd
- 23465 E Lolo Pass Rd
- 23702 E Cedar Point Ct
- 23740 E Lolo Pass Rd
- 70305 E Barlow Trail Rd