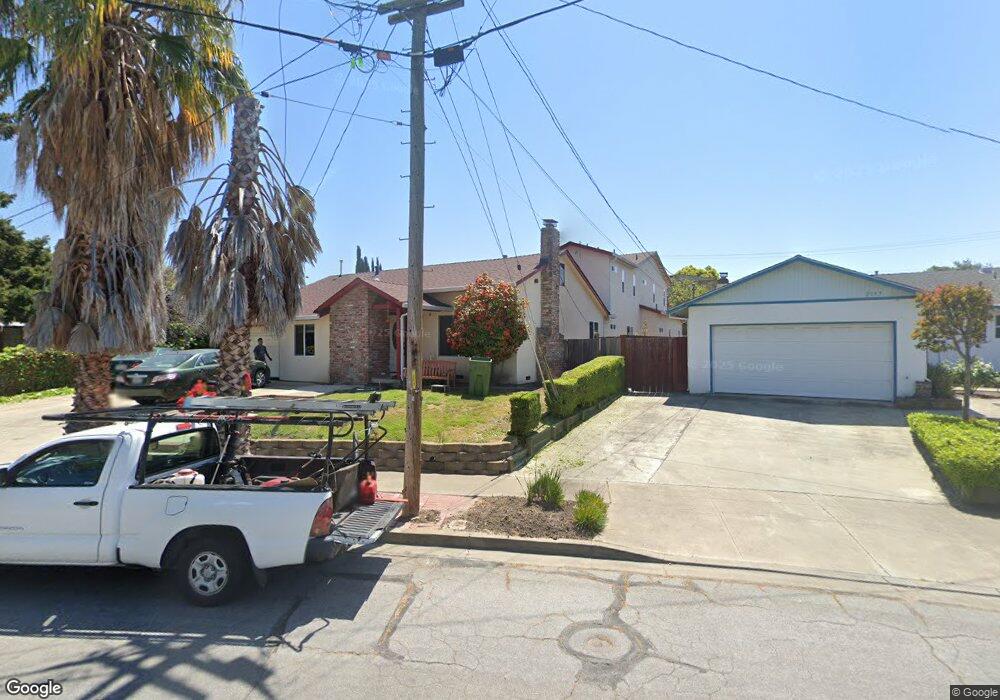
2355 Carpenter Ct Fremont, CA 94539
Mission Valley NeighborhoodEstimated Value: $2,424,000 - $3,289,000
3
Beds
3
Baths
1,832
Sq Ft
$1,558/Sq Ft
Est. Value
About This Home
This home is located at 2355 Carpenter Ct, Fremont, CA 94539 and is currently estimated at $2,853,355, approximately $1,557 per square foot. 2355 Carpenter Ct is a home located in Alameda County with nearby schools including Mission Valley Elementary School, William Hopkins Junior High School, and Mission San Jose High School.
Ownership History
Date
Name
Owned For
Owner Type
Purchase Details
Closed on
Sep 1, 2022
Sold by
Suresh Anuradha
Bought by
Anuradha Suresh 2022 Trust and Suresh
Current Estimated Value
Purchase Details
Closed on
Feb 4, 2004
Sold by
Chen Jack Yu Jar and Chen Brigid M
Bought by
Suresh Anuradha
Home Financials for this Owner
Home Financials are based on the most recent Mortgage that was taken out on this home.
Original Mortgage
$568,000
Interest Rate
5.37%
Mortgage Type
New Conventional
Purchase Details
Closed on
Aug 5, 1999
Sold by
Schwartz Louis G
Bought by
Chen Jack Yu Jar and Chen Brigid M
Home Financials for this Owner
Home Financials are based on the most recent Mortgage that was taken out on this home.
Original Mortgage
$269,200
Interest Rate
5.75%
Create a Home Valuation Report for This Property
The Home Valuation Report is an in-depth analysis detailing your home's value as well as a comparison with similar homes in the area
Home Values in the Area
Average Home Value in this Area
Purchase History
| Date | Buyer | Sale Price | Title Company |
|---|---|---|---|
| Anuradha Suresh 2022 Trust | -- | None Listed On Document | |
| Suresh Anuradha | $710,000 | Ticor Title Company Of Ca | |
| Chen Jack Yu Jar | $336,500 | North American Title Co |
Source: Public Records
Mortgage History
| Date | Status | Borrower | Loan Amount |
|---|---|---|---|
| Previous Owner | Suresh Anuradha | $568,000 | |
| Previous Owner | Chen Jack Yu Jar | $269,200 | |
| Closed | Suresh Anuradha | $35,500 |
Source: Public Records
Tax History Compared to Growth
Tax History
| Year | Tax Paid | Tax Assessment Tax Assessment Total Assessment is a certain percentage of the fair market value that is determined by local assessors to be the total taxable value of land and additions on the property. | Land | Improvement |
|---|---|---|---|---|
| 2025 | $14,199 | $1,204,258 | $302,824 | $908,434 |
| 2024 | $14,199 | $1,180,513 | $296,887 | $890,626 |
| 2023 | $13,828 | $1,164,229 | $291,066 | $873,163 |
| 2022 | $13,662 | $1,134,405 | $285,360 | $856,045 |
| 2021 | $13,323 | $1,112,031 | $279,766 | $839,265 |
| 2020 | $13,406 | $1,107,564 | $276,900 | $830,664 |
| 2019 | $13,250 | $1,085,848 | $271,470 | $814,378 |
| 2018 | $12,992 | $1,064,558 | $266,147 | $798,411 |
| 2017 | $12,667 | $1,043,685 | $260,929 | $782,756 |
| 2016 | $12,458 | $1,023,222 | $255,813 | $767,409 |
| 2015 | $12,299 | $1,007,851 | $251,970 | $755,881 |
| 2014 | $10,152 | $823,450 | $247,035 | $576,415 |
Source: Public Records
Map
Nearby Homes
- 2785 Washington Blvd
- 42077 Miranda St
- 41519 Apricot Ln
- 41620 Beatrice St
- 41538 Casabella Common
- 41411 Apricot Ln
- 41392 Beatrice St
- 3207 Washington Blvd
- 41043 Joyce Ave
- 2851 Finca Terrace
- 1962 Briscoe Terrace
- 1137 Farragut Dr
- 3331 Union St
- 1123 Farragut Dr
- 42111 Osgood Rd Unit 523
- 2813 Pinnacles Terrace
- 40827 Tomales Terrace
- 2164 Ocaso Camino
- 3800 Adams Ave
- 41212 Fremont Blvd
- 2357 Carpenter Ct
- 2353 Carpenter Ct
- 2449 Olive Ave
- 2465 Olive Ave
- 2361 Carpenter Ct
- 2483 Olive Ave
- 2370 Carpenter Ct
- 2351 Carpenter Ct
- 2499 Olive Ave
- 41955 Chadbourne Dr
- 2363 Carpenter Ct
- 41967 Chadbourne Dr
- 2372 Carpenter Ct
- 41943 Chadbourne Dr
- 41979 Chadbourne Dr
- 2347 Carpenter Ct
- 2416 Lockwood Ave
- 2366 Carpenter Ct
- 2513 Olive Ave
- 2365 Carpenter Ct