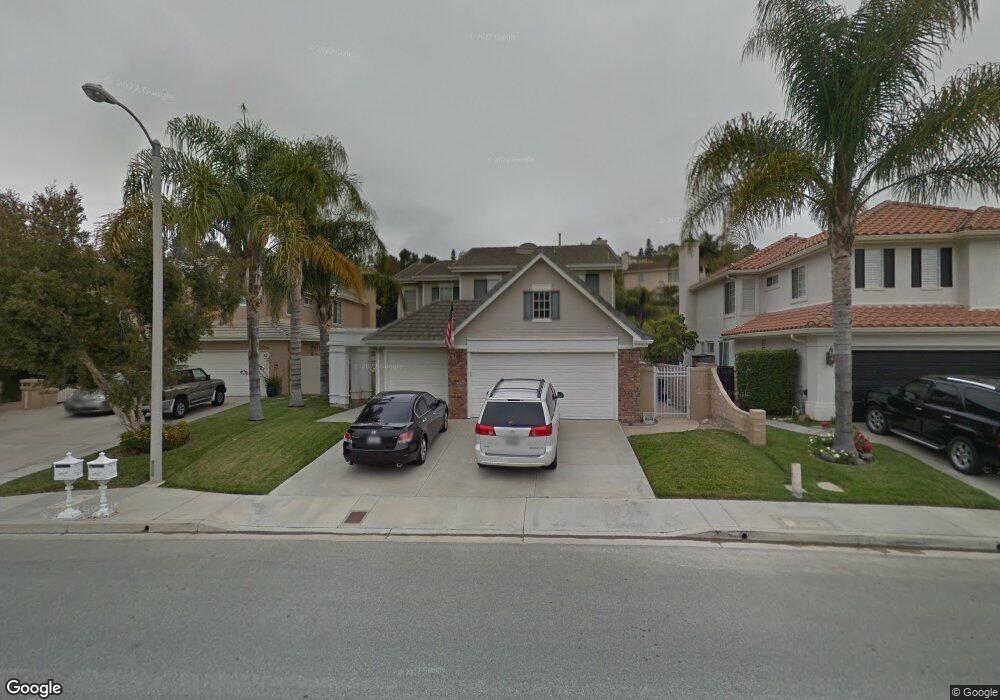
2355 Gillingham Cir Thousand Oaks, CA 91362
Estimated Value: $1,296,000 - $1,394,000
4
Beds
3
Baths
2,322
Sq Ft
$578/Sq Ft
Est. Value
About This Home
This home is located at 2355 Gillingham Cir, Thousand Oaks, CA 91362 and is currently estimated at $1,341,949, approximately $577 per square foot. 2355 Gillingham Cir is a home located in Ventura County with nearby schools including Lang Ranch, Los Cerritos Middle School, and Westlake High School.
Ownership History
Date
Name
Owned For
Owner Type
Purchase Details
Closed on
Jul 28, 2004
Sold by
Miller John A and Miller Kamela L
Bought by
Miller John A and Miller Kamela L
Current Estimated Value
Home Financials for this Owner
Home Financials are based on the most recent Mortgage that was taken out on this home.
Original Mortgage
$473,000
Outstanding Balance
$159,524
Interest Rate
1.25%
Mortgage Type
Negative Amortization
Estimated Equity
$1,182,425
Purchase Details
Closed on
Aug 23, 1996
Sold by
Standard Pacific Corp
Bought by
Miller Kami L and Miller John A
Home Financials for this Owner
Home Financials are based on the most recent Mortgage that was taken out on this home.
Original Mortgage
$258,000
Interest Rate
8.23%
Create a Home Valuation Report for This Property
The Home Valuation Report is an in-depth analysis detailing your home's value as well as a comparison with similar homes in the area
Home Values in the Area
Average Home Value in this Area
Purchase History
| Date | Buyer | Sale Price | Title Company |
|---|---|---|---|
| Miller John A | -- | First American Title Co | |
| Miller Kami L | $324,000 | Chicago Title |
Source: Public Records
Mortgage History
| Date | Status | Borrower | Loan Amount |
|---|---|---|---|
| Open | Miller John A | $473,000 | |
| Closed | Miller Kami L | $258,000 |
Source: Public Records
Tax History Compared to Growth
Tax History
| Year | Tax Paid | Tax Assessment Tax Assessment Total Assessment is a certain percentage of the fair market value that is determined by local assessors to be the total taxable value of land and additions on the property. | Land | Improvement |
|---|---|---|---|---|
| 2025 | $7,337 | $628,070 | $210,074 | $417,996 |
| 2024 | $7,337 | $615,755 | $205,955 | $409,800 |
| 2023 | $7,120 | $603,682 | $201,917 | $401,765 |
| 2022 | $6,979 | $591,846 | $197,958 | $393,888 |
| 2021 | $6,839 | $580,242 | $194,077 | $386,165 |
| 2020 | $6,390 | $574,294 | $192,088 | $382,206 |
| 2019 | $6,220 | $563,034 | $188,322 | $374,712 |
| 2018 | $6,090 | $551,995 | $184,630 | $367,365 |
| 2017 | $5,966 | $541,172 | $181,010 | $360,162 |
| 2016 | $5,904 | $530,561 | $177,461 | $353,100 |
| 2015 | $5,798 | $522,595 | $174,797 | $347,798 |
| 2014 | $5,710 | $512,360 | $171,374 | $340,986 |
Source: Public Records
Map
Nearby Homes
- 2311 Gillingham Cir
- 2347 Laurelwood Dr
- 2321 Sunny Point St
- 3249 Springbrook St
- 2427 Springbrook St
- 2499 Springbrook St
- 2848 Bayham Cir
- 2225 Calle Riscoso
- 3128 Casino Dr
- 3182 Toulouse Cir
- 3240 Casino Dr
- 3180 Versaille Ct
- 2001 Brookfield Dr
- 1914 Sunshine Ct
- 1825 Sweet Briar Place
- 2996 Eagles Claw Ave
- 3386 Montagne Way
- 2535 Rikkard Dr
- 3211 Cove Creek Ct
- 2349 Gillingham Cir
- 2359 Gillingham Cir
- 2343 Gillingham Cir
- 2365 Gillingham Cir
- 2356 Rutland Place
- 2348 Rutland Place
- 2340 Rutland Place
- 2372 Rutland Place
- 2371 Gillingham Cir
- 2324 Rutland Place
- 2380 Rutland Place
- 2308 Rutland Place
- 2358 Gillingham Cir
- 2352 Gillingham Cir
- 2333 Gillingham Cir
- 2300 Rutland Place
- 2375 Gillingham Cir
- 2388 Rutland Place
- 2342 Gillingham Cir
- 2368 Gillingham Cir