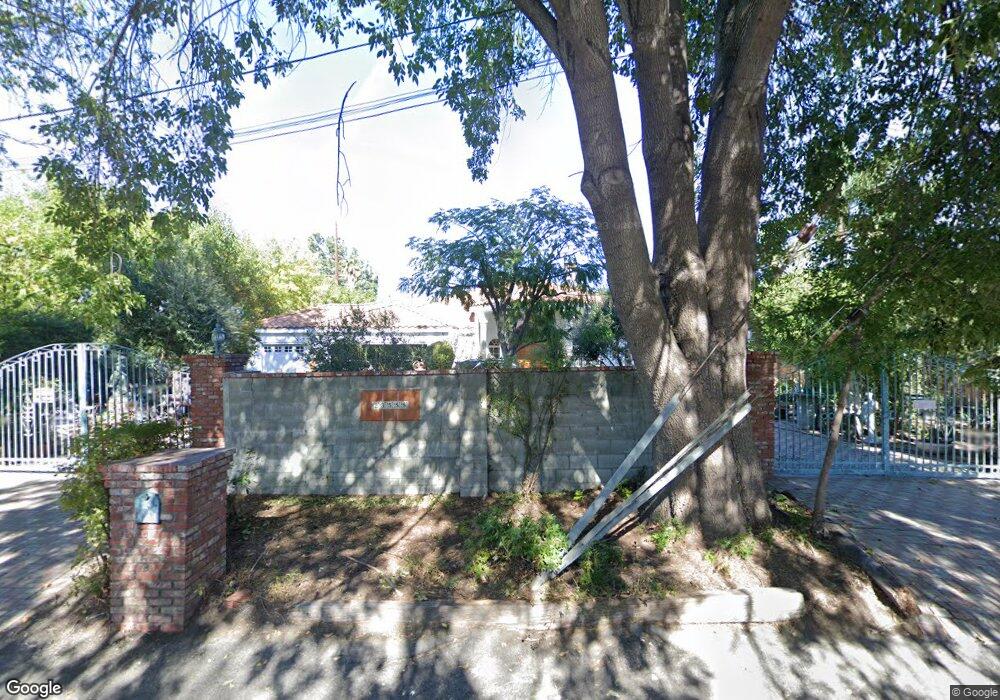
23555 Collins St Woodland Hills, CA 91367
Estimated Value: $2,367,658 - $4,751,000
5
Beds
2
Baths
4,997
Sq Ft
$635/Sq Ft
Est. Value
About This Home
This home is located at 23555 Collins St, Woodland Hills, CA 91367 and is currently estimated at $3,171,915, approximately $634 per square foot. 23555 Collins St is a home located in Los Angeles County with nearby schools including Woodlake Elementary Community Charter, Lockhurst Drive Charter Elementary, and Haynes Charter For Enriched Studies.
Ownership History
Date
Name
Owned For
Owner Type
Purchase Details
Closed on
Jan 25, 2012
Sold by
Mehrpouyan Yokhehbet
Bought by
Mehrpouyan Sara
Current Estimated Value
Home Financials for this Owner
Home Financials are based on the most recent Mortgage that was taken out on this home.
Original Mortgage
$142,000
Outstanding Balance
$17,227
Interest Rate
3.9%
Mortgage Type
New Conventional
Estimated Equity
$3,154,688
Purchase Details
Closed on
May 13, 2002
Sold by
Mehrpouyan Youkevet and Mehrpouyan Sara
Bought by
Mehrpouyan Yokhehbet
Home Financials for this Owner
Home Financials are based on the most recent Mortgage that was taken out on this home.
Original Mortgage
$175,000
Interest Rate
6.89%
Purchase Details
Closed on
May 9, 2001
Sold by
Etebar Shahin
Bought by
Mehrpouyan Youkevet
Create a Home Valuation Report for This Property
The Home Valuation Report is an in-depth analysis detailing your home's value as well as a comparison with similar homes in the area
Home Values in the Area
Average Home Value in this Area
Purchase History
| Date | Buyer | Sale Price | Title Company |
|---|---|---|---|
| Mehrpouyan Sara | -- | Progressive Title Company | |
| Mehrpouyan Yokhehbet | -- | United Title Company | |
| Mehrpouyan Youkevet | -- | -- |
Source: Public Records
Mortgage History
| Date | Status | Borrower | Loan Amount |
|---|---|---|---|
| Open | Mehrpouyan Sara | $142,000 | |
| Closed | Mehrpouyan Yokhehbet | $175,000 |
Source: Public Records
Tax History Compared to Growth
Tax History
| Year | Tax Paid | Tax Assessment Tax Assessment Total Assessment is a certain percentage of the fair market value that is determined by local assessors to be the total taxable value of land and additions on the property. | Land | Improvement |
|---|---|---|---|---|
| 2025 | $11,870 | $935,475 | $687,879 | $247,596 |
| 2024 | $11,870 | $917,134 | $674,392 | $242,742 |
| 2023 | $11,651 | $899,152 | $661,169 | $237,983 |
| 2022 | $11,131 | $881,522 | $648,205 | $233,317 |
| 2021 | $10,976 | $864,239 | $635,496 | $228,743 |
| 2019 | $10,660 | $838,607 | $616,648 | $221,959 |
| 2018 | $10,427 | $822,164 | $604,557 | $217,607 |
| 2016 | $9,933 | $790,240 | $581,082 | $209,158 |
| 2015 | $9,793 | $778,371 | $572,354 | $206,017 |
| 2014 | $9,833 | $763,125 | $561,143 | $201,982 |
Source: Public Records
Map
Nearby Homes
- 5622 Le Sage Ave
- 23442 Burbank Blvd
- 23717 Crosson Dr
- 23346 Collins St
- 23357 Hatteras St
- 23416 Califa St
- 23340 Collins St
- 6001 Manton Ave
- 23853 Hatteras St
- 23701 Clarendon St
- 23236 Hatteras St
- 23242 Burbank Blvd
- 23721 Mariano St
- 5929 Adler Ave
- 23952 Nomar St
- 23201 Oxnard St
- 23143 Dolorosa St
- 5534 Pattilar Ave
- 23812 Calvert St
- 5700 El Canon Ave
- 23549 Collins St
- 5724 Manton Ave
- 5711 Manton Ave
- 23541 Collins St
- 5701 Manton Ave
- 5721 Manton Ave
- 5653 Manton Ave
- 23535 Collins St
- 5734 Manton Ave
- 5729 Manton Ave
- 23560 Collins St
- 23552 Collins St
- 23526 Collins St
- 5708 Le Sage Ave
- 5714 Le Sage Ave
- 23529 Collins St
- 5700 Le Sage Ave
- 23540 Collins St
- 5645 Manton Ave
- 5737 Manton Ave