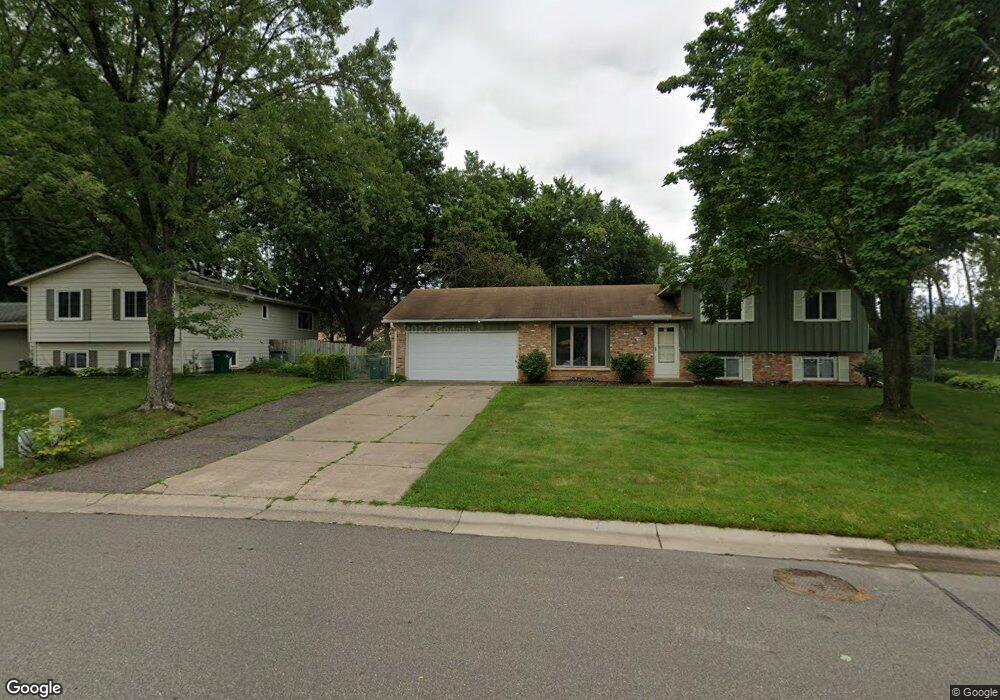
2357 Hidden Valley Ln Stillwater, MN 55082
Estimated Value: $372,000 - $396,000
3
Beds
2
Baths
1,558
Sq Ft
$247/Sq Ft
Est. Value
About This Home
This home is located at 2357 Hidden Valley Ln, Stillwater, MN 55082 and is currently estimated at $385,073, approximately $247 per square foot. 2357 Hidden Valley Ln is a home located in Washington County with nearby schools including Lily Lake Elementary School, Stillwater Middle School, and Stillwater Area High School.
Ownership History
Date
Name
Owned For
Owner Type
Purchase Details
Closed on
Sep 3, 2020
Sold by
Wyman Jamie and Hanson Kristi
Bought by
Nelson Cory
Current Estimated Value
Home Financials for this Owner
Home Financials are based on the most recent Mortgage that was taken out on this home.
Original Mortgage
$256,425
Interest Rate
2.8%
Mortgage Type
New Conventional
Purchase Details
Closed on
Aug 30, 2019
Sold by
Serier Sandra A
Bought by
Hanson Kristi and Wyman Jamie
Home Financials for this Owner
Home Financials are based on the most recent Mortgage that was taken out on this home.
Original Mortgage
$184,800
Interest Rate
3.7%
Mortgage Type
New Conventional
Purchase Details
Closed on
Jun 17, 2005
Sold by
Landgreen Shawn P and Landgreen Molly M
Bought by
Reed Jeff
Purchase Details
Closed on
May 15, 1998
Sold by
Bliven Steven J and Blivin Barbara A
Bought by
Landgreen Shawn P and Landgreen Molly M
Create a Home Valuation Report for This Property
The Home Valuation Report is an in-depth analysis detailing your home's value as well as a comparison with similar homes in the area
Home Values in the Area
Average Home Value in this Area
Purchase History
| Date | Buyer | Sale Price | Title Company |
|---|---|---|---|
| Nelson Cory | $301,500 | Results Title | |
| Hanson Kristi | $231,000 | None Available | |
| Reed Jeff | $213,000 | -- | |
| Landgreen Shawn P | $126,500 | -- |
Source: Public Records
Mortgage History
| Date | Status | Borrower | Loan Amount |
|---|---|---|---|
| Previous Owner | Nelson Cory | $256,425 | |
| Previous Owner | Hanson Kristi | $184,800 |
Source: Public Records
Tax History Compared to Growth
Tax History
| Year | Tax Paid | Tax Assessment Tax Assessment Total Assessment is a certain percentage of the fair market value that is determined by local assessors to be the total taxable value of land and additions on the property. | Land | Improvement |
|---|---|---|---|---|
| 2024 | $3,948 | $342,400 | $140,000 | $202,400 |
| 2023 | $3,948 | $336,300 | $146,900 | $189,400 |
| 2022 | $3,244 | $321,300 | $146,900 | $174,400 |
| 2021 | $2,882 | $273,400 | $125,000 | $148,400 |
| 2020 | $3,170 | $252,200 | $110,000 | $142,200 |
| 2019 | $2,736 | $242,500 | $103,000 | $139,500 |
| 2018 | $2,508 | $226,700 | $98,000 | $128,700 |
| 2017 | $2,496 | $210,500 | $87,000 | $123,500 |
| 2016 | $2,464 | $201,500 | $80,000 | $121,500 |
| 2015 | $2,446 | $181,000 | $72,300 | $108,700 |
| 2013 | -- | $144,400 | $53,900 | $90,500 |
Source: Public Records
Map
Nearby Homes
- 833 Autumn Way
- 1119 Gilbert Ct
- 1008 Northland Ave
- 2660 Fairlawn Dr
- 2501 Hawthorne Ln
- 2834 Wildcrest Ln
- 2840 Brewers Ln
- 2866 Long Lake Dr
- 212 Birchwood Dr N
- XXX Industrial Blvd
- 3350 Staples Place
- 715 Liberty Ct
- 211 Olive St W
- 1311 Meadowlark Dr
- 3415 Heritage Ct
- 27XX Neal Ave N
- 3533 Eben Way
- 976 Creekside Crossing
- 3309 Pioneer Place
- 141 Rutherford Rd
- 2347 Hidden Valley Ln
- 2367 Hidden Valley Ln
- 2337 Hidden Valley Ln
- 2377 Hidden Valley Ln
- 2372 Hidden Valley Ln
- 2366 Hidden Valley Ln
- 2327 Hidden Valley Ln
- 2387 Hidden Valley Ln
- 2388 Hidden Valley Ln
- 6750 Stillwater Blvd N
- 2354 Hidden Valley Ln
- 2410 Hidden Valley Ln
- 2318 Hidden Valley Ln
- 903 Knollwood Ct
- 2342 Hidden Valley Ln
- 2419 Hidden Valley Ln
- 2307 Hidden Valley Ln
- 683 Evergreen Ct
- 667 Evergreen Ct
- 2330 Hidden Valley Ln