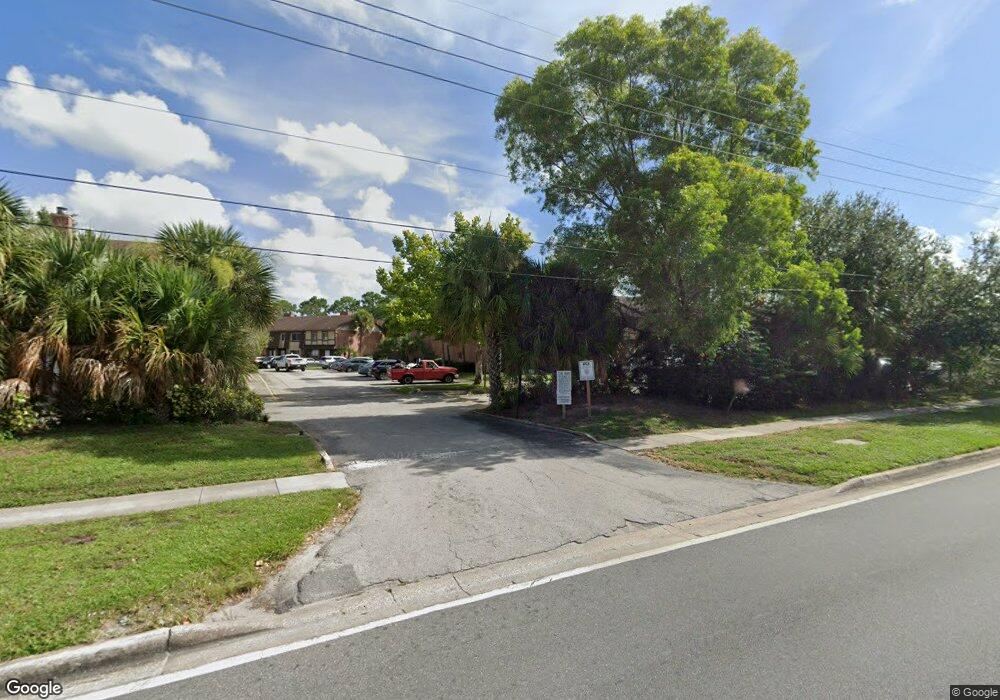
2357 Tom Jones St Unit 10 Orlando, FL 32839
Estimated Value: $178,000 - $205,000
3
Beds
3
Baths
1,405
Sq Ft
$139/Sq Ft
Est. Value
About This Home
This home is located at 2357 Tom Jones St Unit 10, Orlando, FL 32839 and is currently estimated at $195,717, approximately $139 per square foot. 2357 Tom Jones St Unit 10 is a home located in Orange County with nearby schools including Millennia Gardens Elementary, Memorial Middle School, and Oak Ridge High School.
Ownership History
Date
Name
Owned For
Owner Type
Purchase Details
Closed on
Aug 17, 2023
Sold by
Ortiz Angela
Bought by
Gioia Two Llc
Current Estimated Value
Purchase Details
Closed on
Aug 17, 2016
Sold by
G Won Inc
Bought by
Ortiz Angela
Purchase Details
Closed on
Jul 9, 2014
Sold by
Kelly George
Bought by
G Won Inc
Purchase Details
Closed on
Oct 2, 2013
Sold by
Huntington On The Green Condominium Asso
Bought by
Kelly George
Purchase Details
Closed on
Aug 14, 2012
Sold by
Kurbalija Dragan and Davidovic Sladjana
Bought by
Huntington On The Green Condominium Asso
Purchase Details
Closed on
May 20, 2004
Sold by
Johnson Lois N
Bought by
Kurbalija Dragan and Davidovic Sladjana
Home Financials for this Owner
Home Financials are based on the most recent Mortgage that was taken out on this home.
Original Mortgage
$65,000
Interest Rate
6.25%
Mortgage Type
FHA
Create a Home Valuation Report for This Property
The Home Valuation Report is an in-depth analysis detailing your home's value as well as a comparison with similar homes in the area
Home Values in the Area
Average Home Value in this Area
Purchase History
| Date | Buyer | Sale Price | Title Company |
|---|---|---|---|
| Gioia Two Llc | $195,000 | None Listed On Document | |
| Ortiz Angela | $62,000 | Equitable Title Dr Phillips | |
| G Won Inc | -- | None Available | |
| Kelly George | $41,000 | Metro Title Group Llc | |
| Huntington On The Green Condominium Asso | $500 | Attorney | |
| Kurbalija Dragan | $69,900 | Alday Donalson Title Agencie |
Source: Public Records
Mortgage History
| Date | Status | Borrower | Loan Amount |
|---|---|---|---|
| Previous Owner | Kurbalija Dragan | $65,000 | |
| Closed | Kurbalija Dragan | $6,343 |
Source: Public Records
Tax History Compared to Growth
Tax History
| Year | Tax Paid | Tax Assessment Tax Assessment Total Assessment is a certain percentage of the fair market value that is determined by local assessors to be the total taxable value of land and additions on the property. | Land | Improvement |
|---|---|---|---|---|
| 2025 | $2,392 | $153,100 | -- | $153,100 |
| 2024 | $1,682 | $153,100 | -- | $153,100 |
| 2023 | $1,682 | $126,500 | $25,300 | $101,200 |
| 2022 | $1,381 | $91,300 | $18,260 | $73,040 |
| 2021 | $1,253 | $78,700 | $15,740 | $62,960 |
| 2020 | $1,150 | $78,700 | $15,740 | $62,960 |
| 2019 | $1,059 | $64,600 | $12,920 | $51,680 |
| 2018 | $988 | $60,400 | $12,080 | $48,320 |
| 2017 | $898 | $53,400 | $10,680 | $42,720 |
| 2016 | $763 | $48,400 | $9,680 | $38,720 |
| 2015 | $657 | $37,100 | $7,420 | $29,680 |
| 2014 | $667 | $37,100 | $7,420 | $29,680 |
Source: Public Records
Map
Nearby Homes
- 2345 Tom Jones St Unit 4
- 2369 Tom Jones St Unit 8
- 5150 Picadilly Circus Ct Unit 7
- 5144 Picadilly Circus Ct Unit 2
- 5125 Picadilly Circus Ct Unit 3
- 5123 Picadilly Circus Ct Unit 2
- 5084 Downing St Unit 2
- 5214 Via Hacienda Cir Unit A308
- 5220 Via Hacienda Cir Unit A212
- 5208 Via Hacienda Cir Unit 201
- 5231 Via Hacienda Cir Unit B117
- 5213 Via Hacienda Cir Unit B207
- 2352 Grand Central Pkwy Unit 10
- 2406 Grand Central Pkwy Unit 14
- 1948 Lake Atriums Cir Unit 136
- 1948 Lake Atriums Cir Unit 134
- 1948 Lake Atriums Cir Unit 118
- 1948 Lake Atriums Cir Unit 132
- 1948 Lake Atriums Cir Unit 115
- 2424 Grand Central Pkwy Unit 4
- 2357 Tom Jones St
- 2353 Tom Jones St Unit 2
- 2353 Tom Jones St Unit 2C
- 2357 Tom Jones St Unit 1
- 2321 Tom Jones St
- 2333 Tom Jones St
- 2337 Tom Jones St
- 2337 Tom Jones St Unit 6
- 2341 Tom Jones St
- 2341 Tom Jones St Unit 5
- 2329 Tom Jones St
- 2349 Tom Jones St Unit 3
- 2325 Tom Jones St Unit 9
- 2325 Tom Jones St
- 5157 Picadilly Circus Ct Unit 5
- 5165 Picadilly Circus Ct Unit none
- 5149 Picadilly Circus Ct Unit 10
- 5167 Picadilly Circus Ct Unit 10
- 5165 Picadilly Circus Ct Unit 9
- 5149 Picadilly Circus Ct Unit 1A