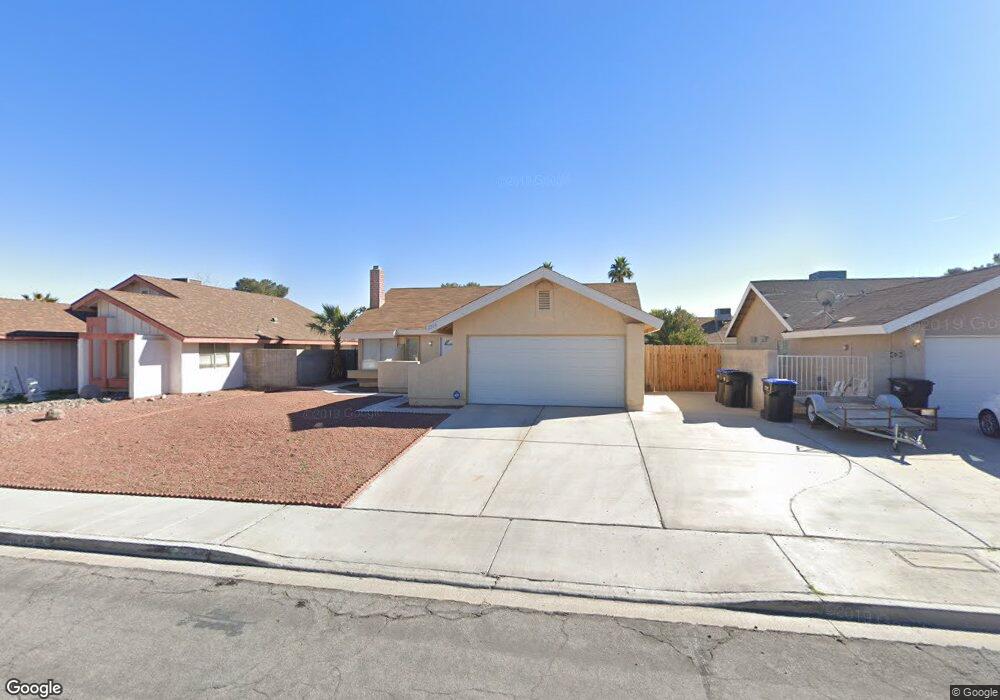
2358 Viewcrest Rd Henderson, NV 89014
Green Valley North NeighborhoodEstimated Value: $314,000 - $392,000
3
Beds
2
Baths
1,303
Sq Ft
$284/Sq Ft
Est. Value
About This Home
This home is located at 2358 Viewcrest Rd, Henderson, NV 89014 and is currently estimated at $369,594, approximately $283 per square foot. 2358 Viewcrest Rd is a home located in Clark County with nearby schools including Nate Mack Elementary School, Barbara and Hank Greenspun Junior High School, and Green Valley High School.
Ownership History
Date
Name
Owned For
Owner Type
Purchase Details
Closed on
Dec 4, 2013
Sold by
Munoz Allen
Bought by
Jaka Llc
Current Estimated Value
Purchase Details
Closed on
Feb 16, 2001
Sold by
Munoz Susan E
Bought by
Munoz Allen
Home Financials for this Owner
Home Financials are based on the most recent Mortgage that was taken out on this home.
Original Mortgage
$135,660
Interest Rate
7.08%
Mortgage Type
VA
Purchase Details
Closed on
Feb 3, 2001
Sold by
Brooks Jeff
Bought by
Munoz Allen
Home Financials for this Owner
Home Financials are based on the most recent Mortgage that was taken out on this home.
Original Mortgage
$135,660
Interest Rate
7.08%
Mortgage Type
VA
Purchase Details
Closed on
Jan 26, 1994
Sold by
Davis Madeline
Bought by
Dague Willard R and Dague Alice E
Create a Home Valuation Report for This Property
The Home Valuation Report is an in-depth analysis detailing your home's value as well as a comparison with similar homes in the area
Home Values in the Area
Average Home Value in this Area
Purchase History
| Date | Buyer | Sale Price | Title Company |
|---|---|---|---|
| Jaka Llc | $123,300 | Accommodation | |
| Munoz Allen | -- | Old Republic Title Company | |
| Munoz Allen | $133,000 | Old Republic Title Company | |
| Dague Willard R | $104,000 | United Title |
Source: Public Records
Mortgage History
| Date | Status | Borrower | Loan Amount |
|---|---|---|---|
| Previous Owner | Munoz Allen | $135,660 |
Source: Public Records
Tax History Compared to Growth
Tax History
| Year | Tax Paid | Tax Assessment Tax Assessment Total Assessment is a certain percentage of the fair market value that is determined by local assessors to be the total taxable value of land and additions on the property. | Land | Improvement |
|---|---|---|---|---|
| 2025 | $1,461 | $62,904 | $37,450 | $25,454 |
| 2024 | $1,353 | $62,904 | $37,450 | $25,454 |
| 2023 | $1,353 | $60,461 | $35,350 | $25,111 |
| 2022 | $1,253 | $54,127 | $30,590 | $23,537 |
| 2021 | $1,161 | $49,353 | $26,600 | $22,753 |
| 2020 | $1,075 | $47,536 | $24,500 | $23,036 |
| 2019 | $1,025 | $45,116 | $22,050 | $23,066 |
| 2018 | $978 | $42,515 | $19,950 | $22,565 |
| 2017 | $1,241 | $42,817 | $19,600 | $23,217 |
| 2016 | $927 | $38,268 | $14,350 | $23,918 |
| 2015 | $924 | $35,153 | $11,200 | $23,953 |
| 2014 | $896 | $33,851 | $9,625 | $24,226 |
Source: Public Records
Map
Nearby Homes
- 15 Pheasant Ridge Dr
- 30 Quail Hollow Dr
- 3117 Valleywood Rd
- 3135 La Mesa Dr
- 128 Quail Run Rd
- 3147 Viewcrest Ave
- 3159 Vistoso Cir
- 3135 La Mancha Way
- 3630 Tobias Ln
- 3138 White Rose Way
- 112 Quail Run Rd
- 3784 Pama Ln
- 3585 Tobias Ln
- 108 Quail Run Rd
- 3105 La Mancha Way
- 3530 Cosima Ln
- 1 Quail Run Rd
- 2406 El Brio Ct
- 3128 Regal Oak Dr
- 3411 Sunfish Dr Unit B
- 2360 Viewcrest Rd
- 2356 Viewcrest Rd
- 2357 Moorpark Way
- 2355 Moorpark Way
- 2359 Moorpark Way
- 2354 Viewcrest Rd
- 2361 Moorpark Way
- 2357 Viewcrest Rd
- 2359 Viewcrest Rd
- 2364 Viewcrest Rd
- 2355 Viewcrest Rd
- 2352 Viewcrest Rd
- 2361 Viewcrest Rd
- 2351 Moorpark Way
- 2363 Moorpark Way
- 2353 Viewcrest Rd
- 2363 Viewcrest Rd
- 2366 Viewcrest Rd
- 3145 Blossom Glen Dr