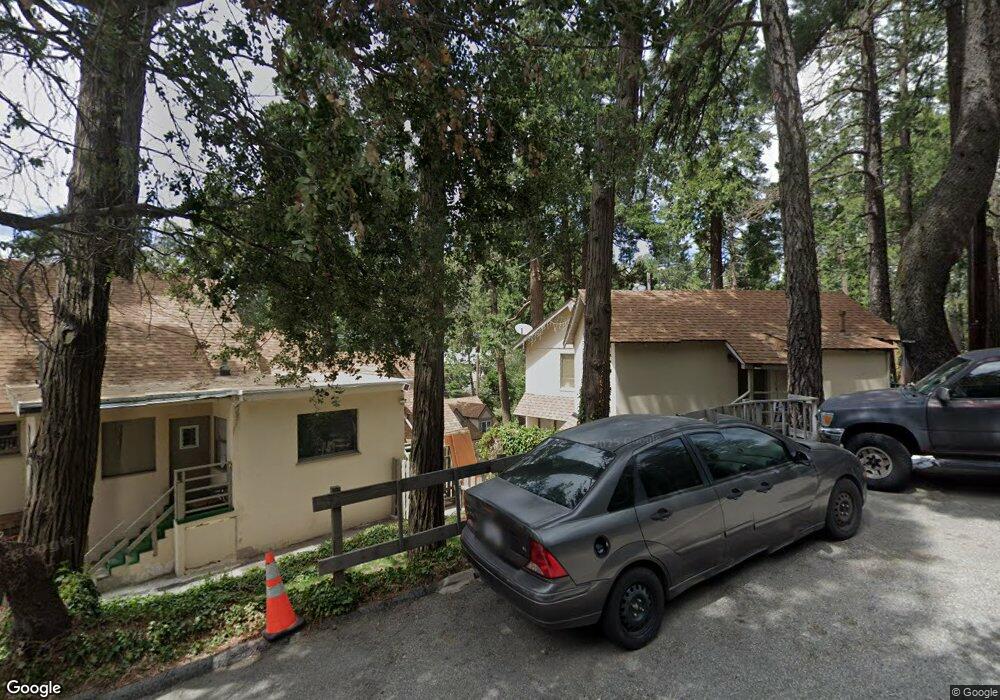
23586 Crest Forest Dr Crestline, CA 92325
Estimated Value: $355,000 - $444,000
Studio
--
Bath
3,671
Sq Ft
$109/Sq Ft
Est. Value
About This Home
This home is located at 23586 Crest Forest Dr, Crestline, CA 92325 and is currently estimated at $399,500, approximately $108 per square foot. 23586 Crest Forest Dr is a home located in San Bernardino County with nearby schools including Valley Of Enchantment Elementary School, Mary P. Henck Intermediate School, and Rim Of The World Senior High School.
Ownership History
Date
Name
Owned For
Owner Type
Purchase Details
Closed on
Apr 21, 2006
Sold by
Devries Paul D
Bought by
Devries Paul D and Devries Maria G
Current Estimated Value
Purchase Details
Closed on
May 30, 1996
Sold by
Devries Paul D and Yanez Paul A
Bought by
Devries Paul D and Gomez Maria G
Home Financials for this Owner
Home Financials are based on the most recent Mortgage that was taken out on this home.
Original Mortgage
$10,000
Outstanding Balance
$639
Interest Rate
8.01%
Mortgage Type
Seller Take Back
Estimated Equity
$398,861
Purchase Details
Closed on
Feb 18, 1995
Sold by
Meads Janet L
Bought by
Kezar Thomas L and Kezar Carol C
Purchase Details
Closed on
Feb 13, 1995
Sold by
Kezar Thomas L and Kezar Carol C
Bought by
Devries Paul D and Yanez Paul A
Create a Home Valuation Report for This Property
The Home Valuation Report is an in-depth analysis detailing your home's value as well as a comparison with similar homes in the area
Home Values in the Area
Average Home Value in this Area
Purchase History
| Date | Buyer | Sale Price | Title Company |
|---|---|---|---|
| Devries Paul D | -- | None Available | |
| Devries Paul D | -- | None Available | |
| Devries Paul D | -- | None Available | |
| Devries Paul D | $10,000 | First American Title Ins Co | |
| Kezar Thomas L | -- | First American Title Ins Co | |
| Devries Paul D | -- | First American Title Ins Co | |
| Devries Paul D | -- | First American Title Ins Co |
Source: Public Records
Mortgage History
| Date | Status | Borrower | Loan Amount |
|---|---|---|---|
| Open | Devries Paul D | $10,000 |
Source: Public Records
Tax History
| Year | Tax Paid | Tax Assessment Tax Assessment Total Assessment is a certain percentage of the fair market value that is determined by local assessors to be the total taxable value of land and additions on the property. | Land | Improvement |
|---|---|---|---|---|
| 2025 | $3,718 | $261,624 | $33,597 | $228,027 |
| 2024 | $3,595 | $256,494 | $32,938 | $223,556 |
| 2023 | $3,554 | $251,465 | $32,292 | $219,173 |
| 2022 | $3,487 | $246,534 | $31,659 | $214,875 |
| 2021 | $3,448 | $241,700 | $31,038 | $210,662 |
| 2020 | $3,444 | $239,222 | $30,720 | $208,502 |
| 2019 | $3,367 | $234,532 | $30,118 | $204,414 |
| 2018 | $3,199 | $229,933 | $29,527 | $200,406 |
| 2017 | $3,147 | $225,424 | $28,948 | $196,476 |
| 2016 | $3,062 | $221,004 | $28,380 | $192,624 |
| 2015 | $3,098 | $216,511 | $27,954 | $188,557 |
| 2014 | $3,060 | $212,269 | $27,406 | $184,863 |
Source: Public Records
Map
Nearby Homes
- 23622 Scenic Dr
- 23752 Inspiration Rd
- 23740 Skyland Dr
- 23812 Inspiration Rd
- 23489 Lake Dr
- 1 Crest Forest Dr
- 0 Crest Forest Dr Unit HD25051850
- 0 Crest Forest Unit HD25238521
- 23774 Lakeview Dr
- 23824 Skyland Dr
- 23776 Lakeview Dr
- 23717 Scenic Dr
- 993 Mercury Way
- 23511 Lake Dr
- 999 Mercury Way
- 0 Saturn Way
- 23804 Lakeview Dr
- 23698 Scenic Dr
- 28710 Highway 18
- 23876 Crest Forest Dr
- 969 Fern Dr
- 967 Fern Dr
- 963 Fern Dr
- 965 Deer Trail
- 23585 Crest Forest Dr
- 23591 Crest Forest Dr
- 957 Fern Dr
- 959 Deer Trail
- 23575 Crest Forest Dr
- 23563 Crest Forest Dr
- 23553 Crestforest Dr
- 953 Deer Trail
- 947 Fern Dr
- 23619 Crest Forest Dr
- 23543 Crest Forest Dr
- 23610 Crest Forest Dr
- 943 Fern Dr
- 1010 Rangers Rd
- 23617 Crest Forest Dr
- 950 Deer Trail
Your Personal Tour Guide
Ask me questions while you tour the home.