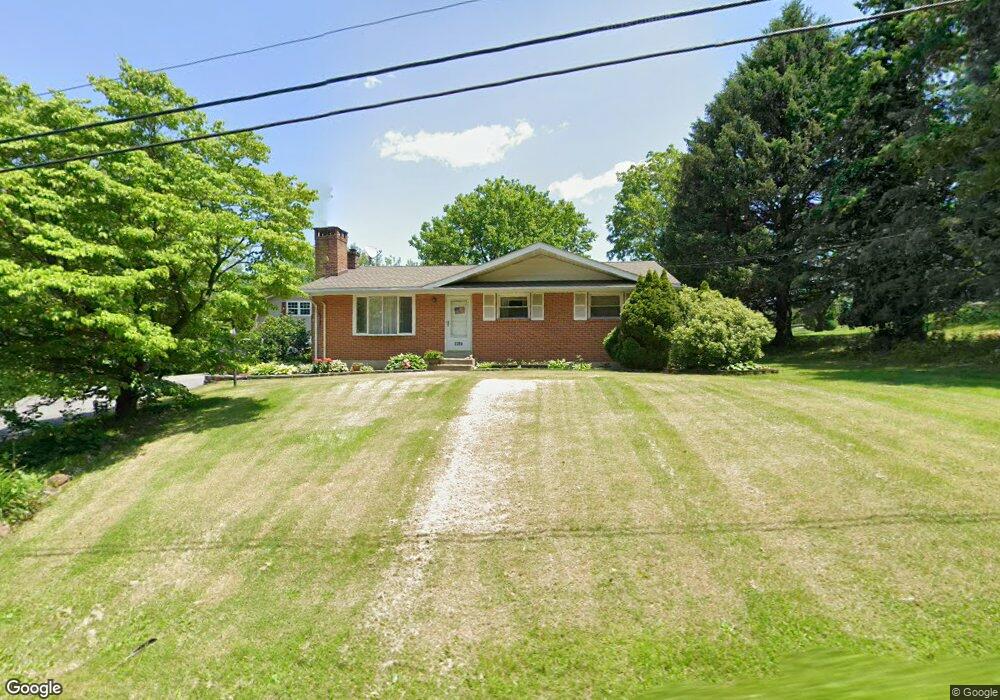
2359 Herman Ln Allentown, PA 18104
South Whitehall Township NeighborhoodEstimated Value: $247,000 - $359,000
2
Beds
1
Bath
1,107
Sq Ft
$265/Sq Ft
Est. Value
About This Home
This home is located at 2359 Herman Ln, Allentown, PA 18104 and is currently estimated at $293,054, approximately $264 per square foot. 2359 Herman Ln is a home located in Lehigh County with nearby schools including Kratzer Elementary School, Orefield Middle School, and Parkland High School.
Ownership History
Date
Name
Owned For
Owner Type
Purchase Details
Closed on
Feb 16, 2024
Sold by
Hebel George Orion
Bought by
Hebel Robert George
Current Estimated Value
Purchase Details
Closed on
Jul 7, 2015
Sold by
Hebel Robert G and Hebel Tracy L
Bought by
Hebel Robert G
Home Financials for this Owner
Home Financials are based on the most recent Mortgage that was taken out on this home.
Original Mortgage
$120,605
Interest Rate
3.87%
Mortgage Type
New Conventional
Purchase Details
Closed on
Oct 31, 1996
Sold by
Fedorishen Gerry A and Donald Mengel
Bought by
Hebel Robert G and Hebel Tracy L
Purchase Details
Closed on
Apr 11, 1996
Sold by
Sec Of Housing & Urban Development
Bought by
Fedorishen Gerry A and Donald Mengel
Purchase Details
Closed on
Mar 23, 1994
Sold by
Sec Of Housing & Urban Development
Bought by
Sec Of Housing & Urban Development
Create a Home Valuation Report for This Property
The Home Valuation Report is an in-depth analysis detailing your home's value as well as a comparison with similar homes in the area
Home Values in the Area
Average Home Value in this Area
Purchase History
| Date | Buyer | Sale Price | Title Company |
|---|---|---|---|
| Hebel Robert George | -- | None Listed On Document | |
| Hebel Robert G | -- | None Available | |
| Hebel Robert G | $116,000 | -- | |
| Fedorishen Gerry A | $81,000 | -- | |
| Sec Of Housing & Urban Development | -- | -- |
Source: Public Records
Mortgage History
| Date | Status | Borrower | Loan Amount |
|---|---|---|---|
| Previous Owner | Hebel Robert G | $120,605 |
Source: Public Records
Tax History Compared to Growth
Tax History
| Year | Tax Paid | Tax Assessment Tax Assessment Total Assessment is a certain percentage of the fair market value that is determined by local assessors to be the total taxable value of land and additions on the property. | Land | Improvement |
|---|---|---|---|---|
| 2025 | $3,385 | $139,200 | $43,200 | $96,000 |
| 2024 | $3,271 | $139,200 | $43,200 | $96,000 |
| 2023 | $3,202 | $139,200 | $43,200 | $96,000 |
| 2022 | $3,189 | $139,200 | $96,000 | $43,200 |
| 2021 | $3,189 | $139,200 | $43,200 | $96,000 |
| 2020 | $3,189 | $139,200 | $43,200 | $96,000 |
| 2019 | $2,846 | $126,600 | $43,200 | $83,400 |
| 2018 | $2,752 | $126,600 | $43,200 | $83,400 |
| 2017 | $2,657 | $126,600 | $43,200 | $83,400 |
| 2016 | -- | $126,600 | $43,200 | $83,400 |
| 2015 | -- | $126,600 | $43,200 | $83,400 |
| 2014 | -- | $126,600 | $43,200 | $83,400 |
Source: Public Records
Map
Nearby Homes
- 2507 Rachael Ln
- 4168 Orefield Rd
- 3756 Huckleberry Rd
- 4082 Rutz Ln
- 1867 Stone Tavern Blvd
- 1551 Wethersfield Dr
- 1488 Shelburne Ct
- 2845 Pacific Ave
- 3816 Walbert Ave
- 1450 Springhouse Rd
- 1702 Platt Ct
- 4403 Wolfs Crossing Rd
- 1707 Sequoia Ct
- 5207 Chandler Way
- 1804 Hemming Way
- 5267 Chandler Way Unit 182
- 1607 Shenandoah Ct
- 1477 Caspian St
- 1128 N 38th St
- 3256 Woodlea Rd
- 2339 Herman Ln
- 2340 Herman Ln
- 2358 Wehr Mill Rd
- 2346 Wehr Mill Rd
- 2303 Herman Ln
- 2395 Wehr Mill Rd
- 2347 Wehr Mill Rd
- 2326 Wehr Mill Rd
- 2379 Herman Ln
- 2400 Wehr Mill Rd
- 2339 Wehr Mill Rd
- 2331 Wehr Mill Rd
- 2282 Wehr Mill Rd
- 2216 Herman Ln
- 4097 Old Sentry Rd
- 4085 Old Sentry Rd
- 4096 Old Sentry Rd
- 2272 Wehr Mill Rd
- 4147 River Rd
- 2530 Wehr Mill Rd