
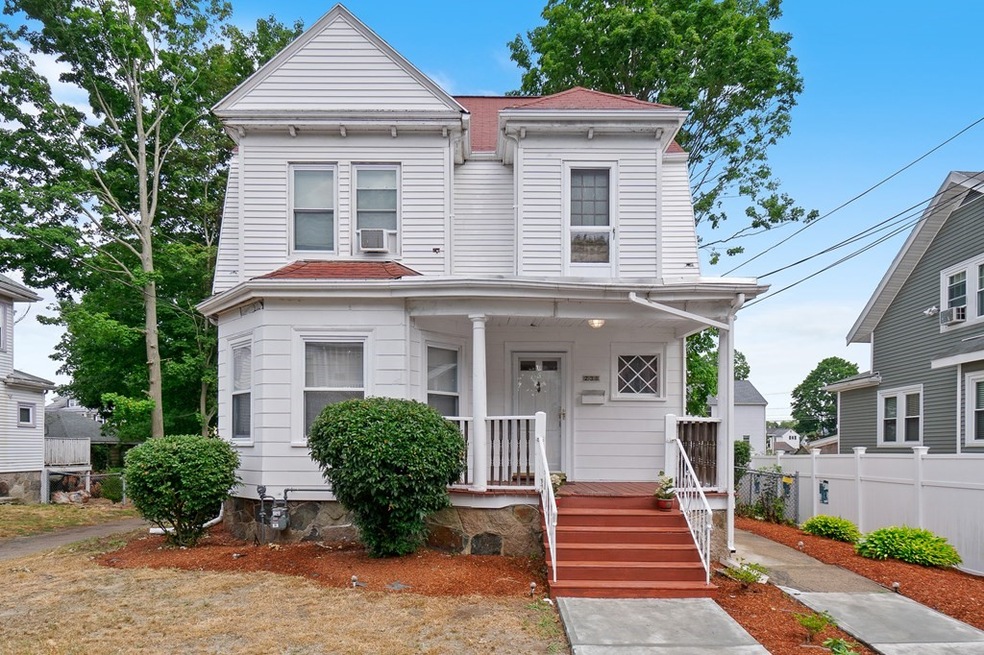
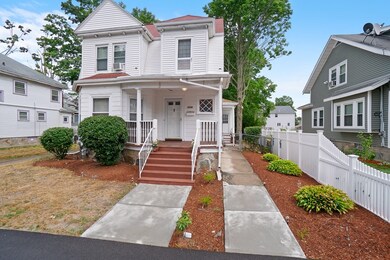
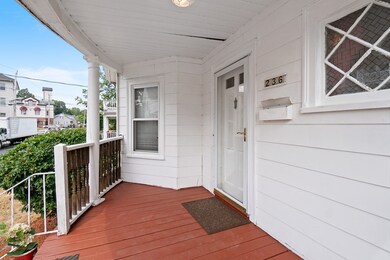
236 Boylston St Brockton, MA 02301
Clifton Heights Neighborhood
4
Beds
2
Baths
1,844
Sq Ft
7,405
Sq Ft Lot
Highlights
- Wood Flooring
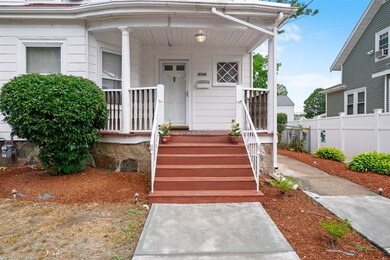
- Porch
- Heating System Uses Steam
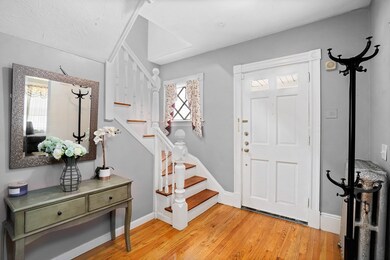
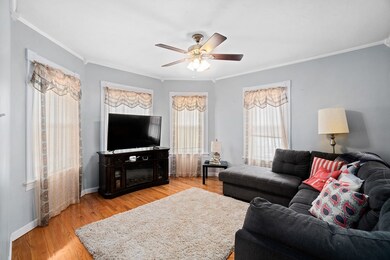
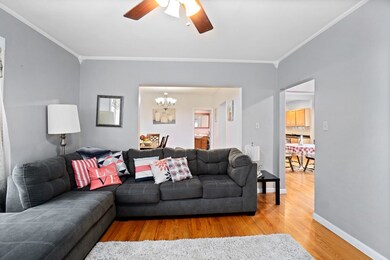
About This Home
As of April 2025THIS IS IT! Spacious for today’s needs while exuding the craftsmanship of yesteryear! Lovely foyer is a great place to hang your coat and put down your keys and opens seamlessly into the eat-in kitchen. Kitchen boasts impeccable cabinet space, stainless steel appliances, and recessed lighting. Formal dining area is open to the living room that is bathed in natural light from the oversized windows. Four bedrooms give privacy and space for everyone and the partially finished basement is great to use as a game room or playroom. Fenced in yard for furry friends to run around and plenty of room for a patio or garden area. This home has been meticulously maintained and has so much to offer. Call today to schedule your private showings before it’s gone! Showings begin at the first open house.
Home Details
Home Type
- Single Family
Est. Annual Taxes
- $5,380
Year Built
- Built in 1915
Utilities
- Heating System Uses Steam
- Heating System Uses Gas
- Natural Gas Water Heater
Additional Features
- Range<<rangeHoodToken>>
- Wood Flooring
- Porch
- Property is zoned R1C
- Basement
Ownership History
Date
Name
Owned For
Owner Type
Purchase Details
Closed on
Oct 20, 2021
Sold by
Prezeau Andy
Bought by
Prezeau Andy and Pina-Prezeau Justa
Current Estimated Value
Home Financials for this Owner
Home Financials are based on the most recent Mortgage that was taken out on this home.
Original Mortgage
$379,805
Interest Rate
2.8%
Mortgage Type
FHA
Purchase Details
Listed on
Aug 13, 2020
Closed on
Sep 29, 2020
Sold by
Paul Lunice
Bought by
Prezeau Andy
Seller's Agent
William Thompson
Keller Williams Elite
Buyer's Agent
Doyle & Waldron Team
Coldwell Banker Realty - Easton
List Price
$349,900
Sold Price
$390,000
Premium/Discount to List
$40,100
11.46%
Home Financials for this Owner
Home Financials are based on the most recent Mortgage that was taken out on this home.
Avg. Annual Appreciation
7.73%
Original Mortgage
$382,936
Interest Rate
2.9%
Mortgage Type
FHA
Purchase Details
Listed on
Mar 13, 2017
Closed on
Jun 9, 2017
Sold by
Deandrade Joao
Bought by
Paul Lunise
Seller's Agent
Lony Andrade
Right Realty, Inc.
Buyer's Agent
William Thompson
Keller Williams Elite
List Price
$309,900
Sold Price
$315,000
Premium/Discount to List
$5,100
1.65%
Home Financials for this Owner
Home Financials are based on the most recent Mortgage that was taken out on this home.
Avg. Annual Appreciation
6.67%
Original Mortgage
$309,294
Interest Rate
4.25%
Mortgage Type
FHA
Purchase Details
Closed on
Oct 2, 2009
Sold by
Wells Fargo Bk
Bought by
Deandrade Joao
Purchase Details
Closed on
Nov 16, 2007
Sold by
Johnson John
Bought by
Wells Fargo Bk
Purchase Details
Closed on
Jan 11, 2006
Sold by
Johnson Debra and Smith Gary A
Bought by
Johnson John
Purchase Details
Closed on
Nov 2, 2004
Sold by
Johnson Debra and Smith Gary A
Bought by
Johnson Debra and Smith Gary A
Purchase Details
Closed on
Oct 7, 2004
Sold by
Johnson Debra
Bought by
Johnson Debra and Smith Gary A
Purchase Details
Closed on
Aug 5, 2004
Sold by
Smith Gary A
Bought by
Johnson Debra
Purchase Details
Closed on
Sep 6, 2001
Sold by
Keaveny Michael J
Bought by
Smith Gary A
Purchase Details
Closed on
Mar 31, 2000
Sold by
Hayes Peter R and Hayes Denise M
Bought by
Keaveny Michael J
Purchase Details
Closed on
Jul 15, 1991
Sold by
Elizabeth Rt
Bought by
Greenblatt Russell L and Greenblatt Lucy Denise
Purchase Details
Closed on
Aug 2, 1990
Sold by
Pierce Beatrice I Est
Bought by
Elizabeth Rt
Similar Homes in Brockton, MA
Create a Home Valuation Report for This Property
The Home Valuation Report is an in-depth analysis detailing your home's value as well as a comparison with similar homes in the area
Home Values in the Area
Average Home Value in this Area
Purchase History
| Date | Type | Sale Price | Title Company |
|---|---|---|---|
| Quit Claim Deed | -- | None Available | |
| Quit Claim Deed | -- | None Available | |
| Quit Claim Deed | -- | None Available | |
| Not Resolvable | $390,000 | None Available | |
| Not Resolvable | $315,000 | -- | |
| Deed | $135,000 | -- | |
| Foreclosure Deed | $228,000 | -- | |
| Foreclosure Deed | $228,000 | -- | |
| Deed | $380,000 | -- | |
| Deed | -- | -- | |
| Deed | -- | -- | |
| Deed | $352,000 | -- | |
| Deed | $212,500 | -- | |
| Deed | $129,900 | -- | |
| Foreclosure Deed | $228,000 | -- | |
| Foreclosure Deed | $228,000 | -- | |
| Deed | $380,000 | -- | |
| Deed | -- | -- | |
| Deed | -- | -- | |
| Deed | $352,000 | -- | |
| Deed | $212,500 | -- | |
| Deed | $114,000 | -- | |
| Deed | $50,000 | -- |
Source: Public Records
Mortgage History
| Date | Status | Loan Amount | Loan Type |
|---|---|---|---|
| Open | $589,132 | FHA | |
| Closed | $589,132 | FHA | |
| Closed | $50,000 | Credit Line Revolving | |
| Closed | $379,805 | FHA | |
| Previous Owner | $382,936 | FHA | |
| Previous Owner | $302,629 | FHA | |
| Previous Owner | $309,294 | FHA |
Source: Public Records
Property History
| Date | Event | Price | Change | Sq Ft Price |
|---|---|---|---|---|
| 04/11/2025 04/11/25 | Sold | $600,000 | 0.0% | $309 / Sq Ft |
| 03/12/2025 03/12/25 | Pending | -- | -- | -- |
| 02/26/2025 02/26/25 | For Sale | $599,777 | 0.0% | $309 / Sq Ft |
| 01/30/2025 01/30/25 | Off Market | $600,000 | -- | -- |
| 01/22/2025 01/22/25 | For Sale | $599,777 | +53.8% | $309 / Sq Ft |
| 09/30/2020 09/30/20 | Sold | $390,000 | +11.5% | $211 / Sq Ft |
| 08/17/2020 08/17/20 | Pending | -- | -- | -- |
| 08/13/2020 08/13/20 | For Sale | $349,900 | +11.1% | $190 / Sq Ft |
| 06/09/2017 06/09/17 | Sold | $315,000 | +5.0% | $171 / Sq Ft |
| 04/18/2017 04/18/17 | Pending | -- | -- | -- |
| 03/24/2017 03/24/17 | Price Changed | $299,900 | -3.2% | $163 / Sq Ft |
| 03/13/2017 03/13/17 | For Sale | $309,900 | -- | $168 / Sq Ft |
Source: MLS Property Information Network (MLS PIN)
Tax History Compared to Growth
Tax History
| Year | Tax Paid | Tax Assessment Tax Assessment Total Assessment is a certain percentage of the fair market value that is determined by local assessors to be the total taxable value of land and additions on the property. | Land | Improvement |
|---|---|---|---|---|
| 2025 | $5,380 | $444,300 | $140,100 | $304,200 |
| 2024 | $5,267 | $438,200 | $140,100 | $298,100 |
| 2023 | $5,387 | $415,000 | $104,200 | $310,800 |
| 2022 | $5,247 | $375,600 | $94,700 | $280,900 |
| 2021 | $5,020 | $346,200 | $78,600 | $267,600 |
| 2020 | $5,177 | $341,700 | $73,700 | $268,000 |
| 2019 | $4,802 | $309,000 | $71,900 | $237,100 |
| 2018 | $4,243 | $234,700 | $71,900 | $162,800 |
| 2017 | $3,349 | $208,000 | $71,900 | $136,100 |
| 2016 | $3,696 | $212,900 | $69,700 | $143,200 |
| 2015 | $3,089 | $170,200 | $69,700 | $100,500 |
| 2014 | $2,948 | $162,600 | $69,700 | $92,900 |
Source: Public Records
Agents Affiliated with this Home
-
Adelino Vicente
Seller's Agent in 2025
Adelino Vicente
Vicente Realty, LLC
(508) 944-3144
39 in this area
179 Total Sales
-
Emiel Barbosa
Seller Co-Listing Agent in 2025
Emiel Barbosa
Vicente Realty, LLC
(508) 762-7848
8 in this area
90 Total Sales
-
Victor Rosario
Buyer's Agent in 2025
Victor Rosario
Rosario Real Estate LLC
(508) 345-9790
25 in this area
119 Total Sales
-
William Thompson
Seller's Agent in 2020
William Thompson
Keller Williams Elite
(774) 280-5764
6 in this area
228 Total Sales
-
Doyle & Waldron Team
Buyer's Agent in 2020
Doyle & Waldron Team
Coldwell Banker Realty - Easton
(774) 250-2221
7 in this area
169 Total Sales
-
L
Seller's Agent in 2017
Lony Andrade
Right Realty, Inc.
Map
Source: MLS Property Information Network (MLS PIN)
MLS Number: 72709629
APN: BROC-000059-000103
Disclaimer: Certain information contained herein is derived from information provided by parties other than Homes.com. All information provided is deemed reliable, but is not guaranteed to be accurate and should be independently verified.
![]() The property listing data and information, or the Images, set forth herein were provided to MLS Property Information Network, Inc. from third party sources, including sellers, lessors and public records, and were compiled by MLS Property Information Network, Inc. The property listing data and information, and the Images, are for the personal, non-commercial use of consumers having a good faith interest in purchasing or leasing listed properties of the type displayed to them and may not be used for any purpose other than to identify prospective properties which such consumers may have a good faith interest in purchasing or leasing. MLS Property Information Network, Inc. and its subscribers disclaim any and all representations and warranties as to the accuracy of the property listing data and information, or as to the accuracy of any of the Images, set forth herein.
The property listing data and information, or the Images, set forth herein were provided to MLS Property Information Network, Inc. from third party sources, including sellers, lessors and public records, and were compiled by MLS Property Information Network, Inc. The property listing data and information, and the Images, are for the personal, non-commercial use of consumers having a good faith interest in purchasing or leasing listed properties of the type displayed to them and may not be used for any purpose other than to identify prospective properties which such consumers may have a good faith interest in purchasing or leasing. MLS Property Information Network, Inc. and its subscribers disclaim any and all representations and warranties as to the accuracy of the property listing data and information, or as to the accuracy of any of the Images, set forth herein.
Nearby Homes