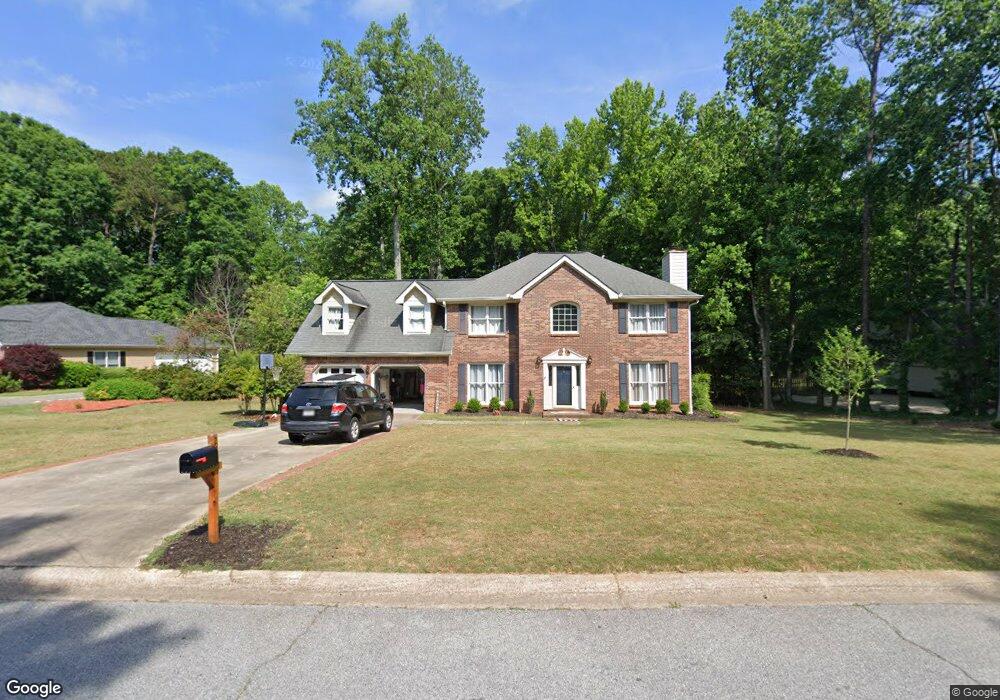
236 Claridge Curve Peachtree City, GA 30269
Estimated Value: $484,000 - $528,000
--
Bed
--
Bath
2,636
Sq Ft
$194/Sq Ft
Est. Value
About This Home
This home is located at 236 Claridge Curve, Peachtree City, GA 30269 and is currently estimated at $510,563, approximately $193 per square foot. 236 Claridge Curve is a home located in Fayette County with nearby schools including Braelinn Elementary School, Rising Starr Middle School, and Starrs Mill High School.
Ownership History
Date
Name
Owned For
Owner Type
Purchase Details
Closed on
Feb 25, 2025
Sold by
Poston Richard L and Poston Gloria
Bought by
Gloria Poston Revocable Trust and Poston
Current Estimated Value
Purchase Details
Closed on
Dec 16, 2016
Sold by
Stogner Eric C
Bought by
Poston Richard L and Poston Gloria
Home Financials for this Owner
Home Financials are based on the most recent Mortgage that was taken out on this home.
Original Mortgage
$195,200
Interest Rate
3.94%
Mortgage Type
New Conventional
Purchase Details
Closed on
Jun 27, 2000
Sold by
Raisor Gregory F and Raisor Dixie L
Bought by
Stogner Eric C and Stogner Kathleen M
Home Financials for this Owner
Home Financials are based on the most recent Mortgage that was taken out on this home.
Original Mortgage
$142,400
Interest Rate
8.3%
Mortgage Type
New Conventional
Create a Home Valuation Report for This Property
The Home Valuation Report is an in-depth analysis detailing your home's value as well as a comparison with similar homes in the area
Home Values in the Area
Average Home Value in this Area
Purchase History
| Date | Buyer | Sale Price | Title Company |
|---|---|---|---|
| Gloria Poston Revocable Trust | -- | None Listed On Document | |
| Poston Richard L | $244,000 | -- | |
| Stogner Eric C | $178,000 | -- |
Source: Public Records
Mortgage History
| Date | Status | Borrower | Loan Amount |
|---|---|---|---|
| Previous Owner | Poston Richard L | $195,200 | |
| Previous Owner | Stogner Eric C | $142,400 |
Source: Public Records
Tax History Compared to Growth
Tax History
| Year | Tax Paid | Tax Assessment Tax Assessment Total Assessment is a certain percentage of the fair market value that is determined by local assessors to be the total taxable value of land and additions on the property. | Land | Improvement |
|---|---|---|---|---|
| 2024 | $5,359 | $181,316 | $22,000 | $159,316 |
| 2023 | $5,269 | $173,680 | $22,000 | $151,680 |
| 2022 | $5,019 | $165,720 | $22,000 | $143,720 |
| 2021 | $4,445 | $144,680 | $22,000 | $122,680 |
| 2020 | $4,244 | $136,680 | $22,000 | $114,680 |
| 2019 | $4,298 | $137,080 | $22,000 | $115,080 |
| 2018 | $3,686 | $115,700 | $20,900 | $94,800 |
| 2017 | $3,130 | $97,572 | $18,812 | $78,760 |
| 2016 | $3,281 | $98,540 | $20,900 | $77,640 |
| 2015 | $3,103 | $91,660 | $20,900 | $70,760 |
| 2014 | $2,877 | $83,500 | $20,900 | $62,600 |
| 2013 | -- | $79,780 | $0 | $0 |
Source: Public Records
Map
Nearby Homes
- 121 Sauterne Way
- 1008 Pinehurst Dr
- 208 Riviera Ct
- 1017 Pinehurst Dr
- 302 Oak Lawn Ct
- 502 Whittington Way
- 239 Masters Dr S
- 130 Augusta Dr
- 313 Evian Way
- 157 Rockspray Ridge
- 121 Tamerlane
- 108 Summit Walk
- 110 Tamerlane
- 209 Monticello Place Unit I
- 1103 Iveydale Ln
- 118 Clarin Way
- 435 Hampton Green
- 100 Endicott Ridge
- 610 Napier Pass
- 2006 Village Park Dr
- 234 Claridge Curve
- 238 Claridge Curve
- 0 Claridge Curve Unit 8675695
- 0 Claridge Curve Unit 8136703
- 0 Claridge Curve Unit 7635349
- 0 Claridge Curve Unit 7430339
- 0 Claridge Curve Unit 8962005
- 0 Claridge Curve Unit LOT 1 & 3 9063149
- Lot 1 & 3 Claridge Curve
- 0 Claridge Curve Unit 8853920
- 0 Claridge Curve Unit Lot 1 & 3 8930887
- Lot 1 & 3 Claridge Curve Unit 1 & 3
- 0 Claridge Curve Unit 3169011
- 0 Claridge Curve Unit 3237838
- 0 Claridge Curve Unit 7243727
- 0 Claridge Curve Unit 7246000
- 0 Claridge Curve Unit 7254624
- 0 Claridge Curve Unit 7290353
- 0 Claridge Curve Unit 7291108
- 0 Claridge Curve Unit 7329030