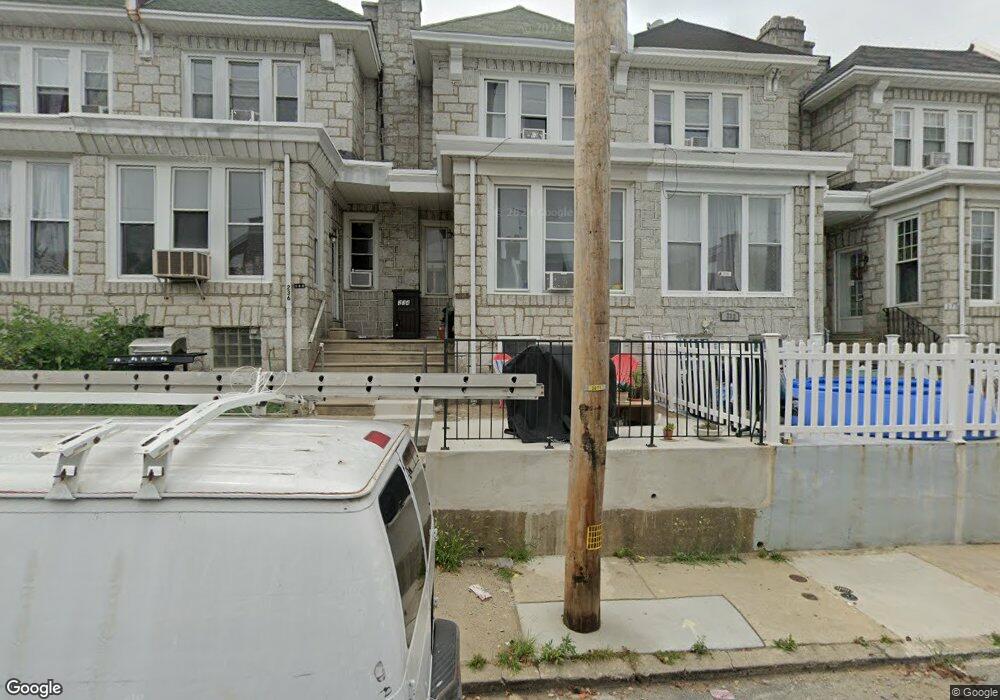
236 Copley Rd Upper Darby, PA 19082
Estimated Value: $143,000 - $189,734
3
Beds
2
Baths
1,416
Sq Ft
$118/Sq Ft
Est. Value
About This Home
This home is located at 236 Copley Rd, Upper Darby, PA 19082 and is currently estimated at $166,934, approximately $117 per square foot. 236 Copley Rd is a home located in Delaware County with nearby schools including Bywood Elementary School, Upper Darby Kdg Center, and Upper Darby High School.
Ownership History
Date
Name
Owned For
Owner Type
Purchase Details
Closed on
May 17, 2021
Sold by
1353 Edgebill Partners Lp
Bought by
Vision Quest Investments 3 Llc
Current Estimated Value
Home Financials for this Owner
Home Financials are based on the most recent Mortgage that was taken out on this home.
Original Mortgage
$6,750,000
Outstanding Balance
$6,097,957
Interest Rate
2.9%
Mortgage Type
Construction
Estimated Equity
-$5,931,023
Purchase Details
Closed on
Jun 27, 2002
Sold by
Gallagher James and Estate Of Bridget Gallagher
Bought by
Jso Lp
Home Financials for this Owner
Home Financials are based on the most recent Mortgage that was taken out on this home.
Original Mortgage
$44,000
Interest Rate
6.82%
Create a Home Valuation Report for This Property
The Home Valuation Report is an in-depth analysis detailing your home's value as well as a comparison with similar homes in the area
Home Values in the Area
Average Home Value in this Area
Purchase History
| Date | Buyer | Sale Price | Title Company |
|---|---|---|---|
| Vision Quest Investments 3 Llc | -- | None Available | |
| Jso Lp | $42,500 | T A Title Insurance Company |
Source: Public Records
Mortgage History
| Date | Status | Borrower | Loan Amount |
|---|---|---|---|
| Open | Vision Quest Investments 3 Llc | $6,750,000 | |
| Previous Owner | Jso Lp | $44,000 |
Source: Public Records
Tax History Compared to Growth
Tax History
| Year | Tax Paid | Tax Assessment Tax Assessment Total Assessment is a certain percentage of the fair market value that is determined by local assessors to be the total taxable value of land and additions on the property. | Land | Improvement |
|---|---|---|---|---|
| 2025 | $2,087 | $49,350 | $20,000 | $29,350 |
| 2024 | $2,087 | $49,350 | $20,000 | $29,350 |
| 2023 | $3,808 | $90,890 | $21,930 | $68,960 |
| 2022 | $3,705 | $90,890 | $21,930 | $68,960 |
| 2021 | $4,996 | $90,890 | $21,930 | $68,960 |
| 2020 | $2,393 | $37,000 | $17,060 | $19,940 |
| 2019 | $2,351 | $37,000 | $17,060 | $19,940 |
| 2018 | $2,324 | $37,000 | $0 | $0 |
| 2017 | $2,264 | $37,000 | $0 | $0 |
| 2016 | $207 | $37,000 | $0 | $0 |
| 2015 | $207 | $37,000 | $0 | $0 |
| 2014 | $207 | $37,000 | $0 | $0 |
Source: Public Records
Map
Nearby Homes