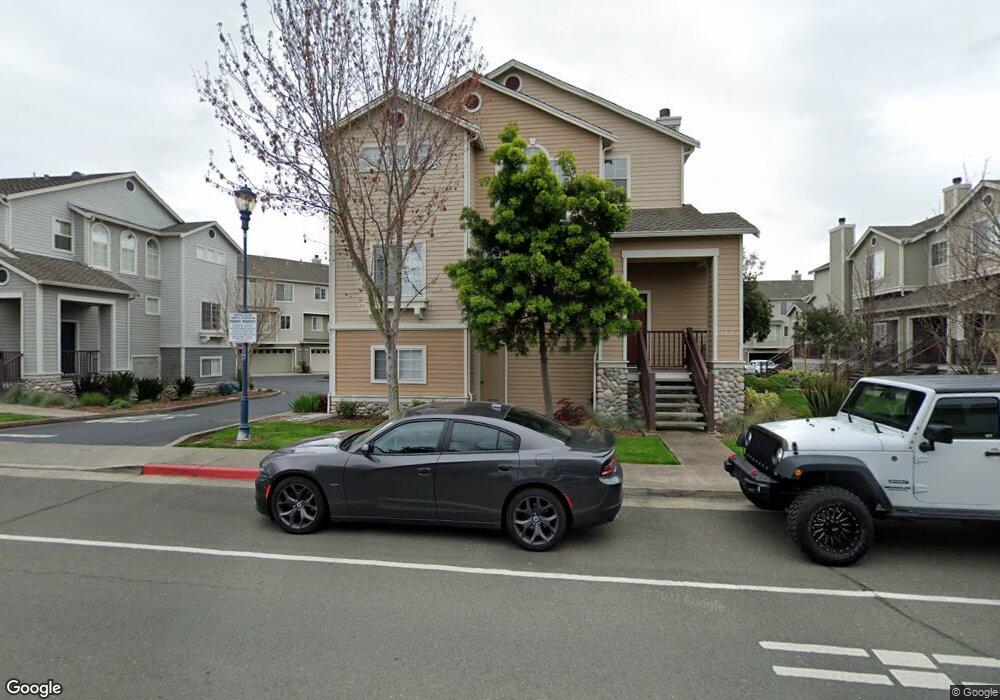
236 E E St Unit 12 Benicia, CA 94510
Estimated Value: $638,000 - $709,000
3
Beds
3
Baths
1,440
Sq Ft
$475/Sq Ft
Est. Value
About This Home
This home is located at 236 E E St Unit 12, Benicia, CA 94510 and is currently estimated at $684,678, approximately $475 per square foot. 236 E E St Unit 12 is a home located in Solano County with nearby schools including Mary Farmar Elementary School, Benicia Middle School, and Benicia High School.
Ownership History
Date
Name
Owned For
Owner Type
Purchase Details
Closed on
Dec 10, 2015
Sold by
Henretty Edward W and Henretty Barbara J
Bought by
Henretty Edward W and Henretty Barbara J
Current Estimated Value
Purchase Details
Closed on
Jun 24, 2015
Sold by
Henretty Edward W and Henretty Barbara J
Bought by
Henretty Living Trust and Henretty Barbara J
Purchase Details
Closed on
Jun 16, 2014
Sold by
Saadat Patricia A and Saadat Ebrahim
Bought by
Liversedge Properties Llc
Purchase Details
Closed on
Jul 14, 1998
Sold by
Kaufman & Broad Of Northern Ca Inc
Bought by
Saadat Ebrahim and Saadat Patricia A
Home Financials for this Owner
Home Financials are based on the most recent Mortgage that was taken out on this home.
Original Mortgage
$147,950
Interest Rate
7%
Create a Home Valuation Report for This Property
The Home Valuation Report is an in-depth analysis detailing your home's value as well as a comparison with similar homes in the area
Home Values in the Area
Average Home Value in this Area
Purchase History
| Date | Buyer | Sale Price | Title Company |
|---|---|---|---|
| Henretty Edward W | -- | None Available | |
| Henretiy Edward W | -- | None Available | |
| Henretty Living Trust | -- | None Available | |
| Liversedge Properties Llc | $395,000 | North American Title Co Inc | |
| Saadat Ebrahim | $185,000 | First American Title |
Source: Public Records
Mortgage History
| Date | Status | Borrower | Loan Amount |
|---|---|---|---|
| Previous Owner | Saadat Ebrahim | $147,950 |
Source: Public Records
Tax History
| Year | Tax Paid | Tax Assessment Tax Assessment Total Assessment is a certain percentage of the fair market value that is determined by local assessors to be the total taxable value of land and additions on the property. | Land | Improvement |
|---|---|---|---|---|
| 2025 | $7,584 | $646,996 | $145,573 | $501,423 |
| 2024 | $7,584 | $634,311 | $142,719 | $491,592 |
| 2023 | $7,402 | $621,874 | $139,921 | $481,953 |
| 2022 | $7,264 | $609,681 | $137,178 | $472,503 |
| 2021 | $7,116 | $597,728 | $134,489 | $463,239 |
| 2020 | $7,022 | $591,600 | $133,110 | $458,490 |
| 2019 | $5,167 | $434,068 | $109,890 | $324,178 |
| 2018 | $5,035 | $425,558 | $107,736 | $317,822 |
| 2017 | $4,919 | $417,215 | $105,624 | $311,591 |
| 2016 | $4,959 | $409,035 | $103,553 | $305,482 |
| 2015 | $4,833 | $402,892 | $101,998 | $300,894 |
| 2014 | -- | $246,182 | $73,534 | $172,648 |
Source: Public Records
Map
Nearby Homes
- 234 E E St Unit 11
- 238 E E St
- 232 E E St
- 206 E E St Unit 8
- 204 E E St Unit 7
- 208 E E St Unit 2
- 250 E E St Unit 14
- 202 E E St
- 246 E E St
- 244 E E St
- 242 E E St Unit 29
- 252 E E St Unit 15
- 224 E E St Unit 26
- 226 E E St Unit 27
- 228 E E St Unit 28
- 222 E E St Unit 25
- 254 E E St
- 218 E E St
- 256 E E St
- 460 E 2nd St
Your Personal Tour Guide
Ask me questions while you tour the home.