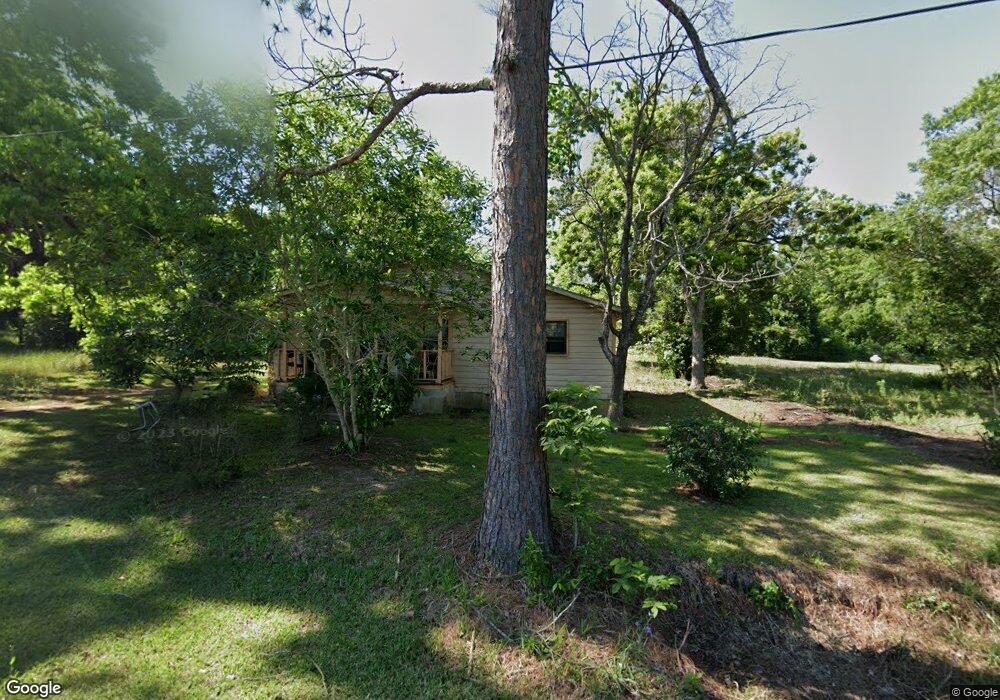
236 E Ruby St Boston, GA 31626
Estimated Value: $56,703 - $200,000
Studio
1
Bath
1,080
Sq Ft
$132/Sq Ft
Est. Value
About This Home
This home is located at 236 E Ruby St, Boston, GA 31626 and is currently estimated at $142,568, approximately $132 per square foot. 236 E Ruby St is a home located in Thomas County with nearby schools including Hand in Hand Primary School, Garrison-Pilcher Elementary School, and Cross Creek Elementary School.
Ownership History
Date
Name
Owned For
Owner Type
Purchase Details
Closed on
Oct 13, 2008
Sold by
Brown Lillie Mae
Bought by
Dennis Donald
Current Estimated Value
Create a Home Valuation Report for This Property
The Home Valuation Report is an in-depth analysis detailing your home's value as well as a comparison with similar homes in the area
Purchase History
| Date | Buyer | Sale Price | Title Company |
|---|---|---|---|
| Dennis Donald | -- | -- |
Source: Public Records
Tax History
| Year | Tax Paid | Tax Assessment Tax Assessment Total Assessment is a certain percentage of the fair market value that is determined by local assessors to be the total taxable value of land and additions on the property. | Land | Improvement |
|---|---|---|---|---|
| 2025 | $644 | $12,095 | $4,553 | $7,542 |
| 2024 | $230 | $11,861 | $4,553 | $7,308 |
| 2023 | $220 | $11,404 | $4,553 | $6,851 |
| 2022 | $76 | $9,397 | $3,415 | $5,982 |
| 2021 | $71 | $8,383 | $3,415 | $4,968 |
| 2020 | $75 | $8,551 | $3,415 | $5,136 |
| 2019 | $75 | $8,551 | $3,415 | $5,136 |
| 2018 | $79 | $8,824 | $3,415 | $5,409 |
| 2017 | $74 | $8,286 | $3,039 | $5,247 |
| 2016 | $176 | $8,024 | $3,039 | $4,985 |
| 2015 | $207 | $7,137 | $2,834 | $4,302 |
| 2014 | $248 | $10,483 | $2,834 | $7,649 |
| 2013 | -- | $10,483 | $2,834 | $7,648 |
Source: Public Records
Map
Nearby Homes
- 365& 371 Oakridge Ave
- 612-BN W Railroad Ave
- 611 Bn S Main St
- 146 Old Highway 84 W
- 2773 Georgia 33
- 75 Southern Breeze Ln
- 0000 0000 Ozell Road (15+ - Acres)
- 9900 Ozell Rd
- 0 Ozell Rd Unit 26629849
- 2815 Parker Rd
- 7402 Coffee Rd
- 2156 County Road 78
- 2195 Coffee Rd
- 1477 Fox Meadow Ln
- 390 Crabapple Dr
- 00 Cone Road & Beulah Church Rd
- 1038-BA Church St
- 2951 Summerhill Rd
- 138
- 12431 US Highway 84 E
- 236 E Ruby St
- 244 E Ruby St
- Lot 23 Taft St Unit 23
- Lot 24 Taft St Unit 24
- Lot 25 Taft St Unit 25
- 517 Taft St Unit 23
- Lot 26 Taft St Unit 26
- 513 N Green St
- 545 Taft St
- 520 Taft St
- 529 Taft St
- 623 N Green St
- 538 N Green St
- 521 Taft St
- 546 N Green St
- 211 E Garnett St
- 522 N Green St
- 505 N Green St
- 512 N Green St
- 433 N Green St
Your Personal Tour Guide
Ask me questions while you tour the home.