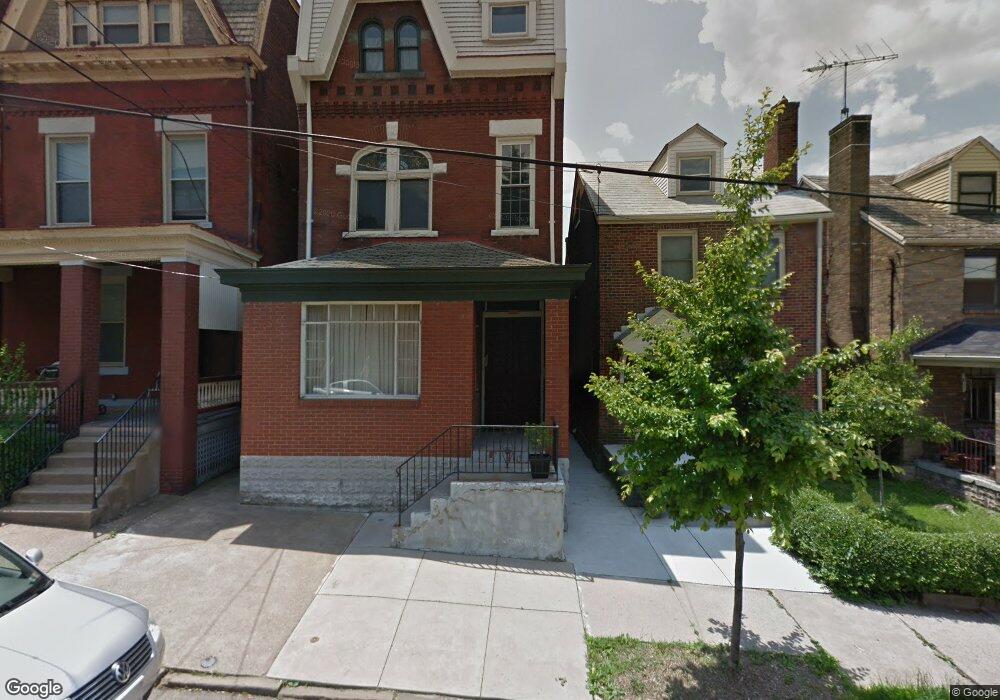
236 Fisk St Pittsburgh, PA 15201
Central Lawrenceville NeighborhoodEstimated Value: $516,552 - $563,000
4
Beds
2
Baths
2,418
Sq Ft
$225/Sq Ft
Est. Value
About This Home
This home is located at 236 Fisk St, Pittsburgh, PA 15201 and is currently estimated at $545,138, approximately $225 per square foot. 236 Fisk St is a home located in Allegheny County with nearby schools including Pittsburgh Arsenal K-5, Pittsburgh Arsenal 6-8, and Pittsburgh Milliones 6-12.
Ownership History
Date
Name
Owned For
Owner Type
Purchase Details
Closed on
Sep 18, 2020
Sold by
Erb Matthew B
Bought by
Erb Matthew B and Melino Jordyn
Current Estimated Value
Purchase Details
Closed on
Mar 12, 2010
Sold by
Kopczyk Helen V and Ober Patricia A
Bought by
Erb Matthew B
Home Financials for this Owner
Home Financials are based on the most recent Mortgage that was taken out on this home.
Original Mortgage
$104,080
Outstanding Balance
$69,906
Interest Rate
5.25%
Mortgage Type
FHA
Estimated Equity
$475,232
Create a Home Valuation Report for This Property
The Home Valuation Report is an in-depth analysis detailing your home's value as well as a comparison with similar homes in the area
Home Values in the Area
Average Home Value in this Area
Purchase History
| Date | Buyer | Sale Price | Title Company |
|---|---|---|---|
| Erb Matthew B | -- | None Available | |
| Erb Matthew B | $106,000 | -- |
Source: Public Records
Mortgage History
| Date | Status | Borrower | Loan Amount |
|---|---|---|---|
| Open | Erb Matthew B | $104,080 |
Source: Public Records
Tax History Compared to Growth
Tax History
| Year | Tax Paid | Tax Assessment Tax Assessment Total Assessment is a certain percentage of the fair market value that is determined by local assessors to be the total taxable value of land and additions on the property. | Land | Improvement |
|---|---|---|---|---|
| 2025 | $2,484 | $107,800 | $58,200 | $49,600 |
| 2024 | $2,484 | $107,800 | $58,200 | $49,600 |
| 2023 | $2,484 | $107,800 | $58,200 | $49,600 |
| 2022 | $2,451 | $107,800 | $58,200 | $49,600 |
| 2021 | $2,381 | $107,800 | $58,200 | $49,600 |
| 2020 | $2,440 | $107,800 | $58,200 | $49,600 |
| 2019 | $2,440 | $107,800 | $58,200 | $49,600 |
| 2018 | $1,864 | $107,800 | $58,200 | $49,600 |
| 2017 | $2,440 | $107,800 | $58,200 | $49,600 |
| 2016 | $510 | $107,800 | $58,200 | $49,600 |
| 2015 | $510 | $107,800 | $58,200 | $49,600 |
| 2014 | $2,386 | $85,100 | $58,200 | $26,900 |
Source: Public Records
Map
Nearby Homes