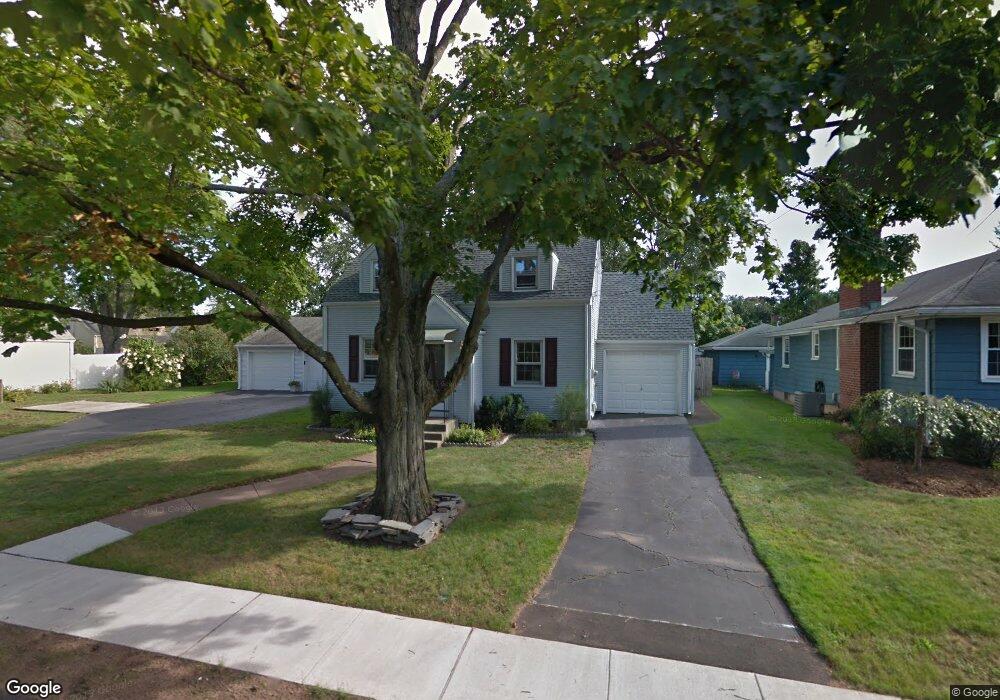
236 High St W Manchester, CT 06040
West Side NeighborhoodEstimated Value: $313,000 - $331,235
3
Beds
2
Baths
1,326
Sq Ft
$243/Sq Ft
Est. Value
About This Home
This home is located at 236 High St W, Manchester, CT 06040 and is currently estimated at $321,809, approximately $242 per square foot. 236 High St W is a home located in Hartford County with nearby schools including Elisabeth M. Bennet Academy, Illing Middle School, and Manchester High School.
Ownership History
Date
Name
Owned For
Owner Type
Purchase Details
Closed on
Mar 5, 2018
Sold by
Vernier Frank J and Shores Lindsey A
Bought by
Vernier Frank J and Vernier Ronald W
Current Estimated Value
Home Financials for this Owner
Home Financials are based on the most recent Mortgage that was taken out on this home.
Original Mortgage
$151,000
Outstanding Balance
$128,336
Interest Rate
4.04%
Mortgage Type
Credit Line Revolving
Estimated Equity
$193,473
Purchase Details
Closed on
Jul 14, 2014
Sold by
Frazier Burton L and Frazier Mary L
Bought by
Vernier Frank J and Shores Lindsey A
Home Financials for this Owner
Home Financials are based on the most recent Mortgage that was taken out on this home.
Original Mortgage
$164,957
Interest Rate
4.12%
Mortgage Type
FHA
Purchase Details
Closed on
Dec 29, 1995
Sold by
Kowalski Kazimiera
Bought by
Akil Abdul and Akil Mary
Home Financials for this Owner
Home Financials are based on the most recent Mortgage that was taken out on this home.
Original Mortgage
$133,700
Interest Rate
7.33%
Mortgage Type
Unknown
Create a Home Valuation Report for This Property
The Home Valuation Report is an in-depth analysis detailing your home's value as well as a comparison with similar homes in the area
Home Values in the Area
Average Home Value in this Area
Purchase History
| Date | Buyer | Sale Price | Title Company |
|---|---|---|---|
| Vernier Frank J | -- | -- | |
| Vernier Frank J | -- | -- | |
| Vernier Frank J | $168,000 | -- | |
| Vernier Frank J | $168,000 | -- | |
| Akil Abdul | $135,000 | -- | |
| Akil Abdul | $135,000 | -- |
Source: Public Records
Mortgage History
| Date | Status | Borrower | Loan Amount |
|---|---|---|---|
| Open | Vernier Frank J | $151,000 | |
| Previous Owner | Akil Abdul | $164,957 | |
| Previous Owner | Akil Abdul | $133,700 |
Source: Public Records
Tax History Compared to Growth
Tax History
| Year | Tax Paid | Tax Assessment Tax Assessment Total Assessment is a certain percentage of the fair market value that is determined by local assessors to be the total taxable value of land and additions on the property. | Land | Improvement |
|---|---|---|---|---|
| 2025 | $6,718 | $168,700 | $40,300 | $128,400 |
| 2024 | $6,525 | $168,700 | $40,300 | $128,400 |
| 2023 | $6,276 | $168,700 | $40,300 | $128,400 |
| 2022 | $6,093 | $168,700 | $40,300 | $128,400 |
| 2021 | $5,371 | $128,100 | $34,600 | $93,500 |
| 2020 | $5,364 | $128,100 | $34,600 | $93,500 |
| 2019 | $5,342 | $128,100 | $34,600 | $93,500 |
| 2018 | $5,241 | $128,100 | $34,600 | $93,500 |
| 2017 | $5,092 | $128,100 | $34,600 | $93,500 |
| 2016 | $5,186 | $130,700 | $44,000 | $86,700 |
| 2015 | $5,071 | $128,700 | $44,000 | $84,700 |
| 2014 | $4,688 | $121,300 | $44,000 | $77,300 |
Source: Public Records
Map
Nearby Homes
- 158 Mckee St
- 142 W Center St
- 29 Summer St
- 37 Seaman Cir
- 20 Thompson Rd Unit 8A
- 4 Tyler Cir
- 43 Pioneer Cir
- 14 Saint Lawrence St
- 600 Center St
- 102 Wetherell St Unit 16
- 21 Trebbe Dr
- 72 Pine St
- 26 Prospect St Unit 17
- 28 Devon Dr
- 633 Center St Unit E
- 633 Center St Unit A
- 36 Oleary Dr
- 21 Saint John St
- 15 Saint John St
- 18 Chalmers St
- 242 High St W
- 40 Campfield Rd
- 246 High St W
- 21 Courtland St
- 44 Campfield Rd
- 13 Courtland St
- 25 Courtland St
- 30 Campfield Rd
- 250 High St W
- 235 High St W
- 29 Courtland St
- 241 High St W
- 48 Campfield Rd
- 245 High St W
- 254 High St W
- 33 Courtland St
- 22 Campfield Rd
- 54 Campfield Rd
- 249 High St W
- 37 Courtland St