236 Hockney Ave Unit 114 Mountain View, CA 94041
Estimated Value: $1,591,000 - $1,690,000
3
Beds
3
Baths
1,637
Sq Ft
$1,001/Sq Ft
Est. Value
About This Home
This home is located at 236 Hockney Ave Unit 114, Mountain View, CA 94041 and is currently estimated at $1,637,881, approximately $1,000 per square foot. 236 Hockney Ave Unit 114 is a home located in Santa Clara County with nearby schools including Edith Landels Elementary School, Isaac Newton Graham Middle School, and Mountain View High School.
Ownership History
Date
Name
Owned For
Owner Type
Purchase Details
Closed on
Sep 23, 2017
Sold by
Chua Sean
Bought by
Chua Sean Pierre S and Chua Ge Family Trust
Current Estimated Value
Purchase Details
Closed on
Nov 1, 2011
Sold by
Shea Homes Limited Partnership
Bought by
Chua Ian and Chua Sean
Home Financials for this Owner
Home Financials are based on the most recent Mortgage that was taken out on this home.
Original Mortgage
$379,500
Outstanding Balance
$258,782
Interest Rate
4.02%
Mortgage Type
New Conventional
Estimated Equity
$1,379,099
Purchase Details
Closed on
Oct 31, 2011
Sold by
Shea Homes Limited Partnership
Bought by
Zhu Baozhen
Home Financials for this Owner
Home Financials are based on the most recent Mortgage that was taken out on this home.
Original Mortgage
$379,500
Outstanding Balance
$258,782
Interest Rate
4.02%
Mortgage Type
New Conventional
Estimated Equity
$1,379,099
Create a Home Valuation Report for This Property
The Home Valuation Report is an in-depth analysis detailing your home's value as well as a comparison with similar homes in the area
Purchase History
| Date | Buyer | Sale Price | Title Company |
|---|---|---|---|
| Chua Sean Pierre S | -- | None Available | |
| Chua Ian | $704,500 | First American Title Company | |
| Zhu Baozhen | $722,000 | First American Title Company |
Source: Public Records
Mortgage History
| Date | Status | Borrower | Loan Amount |
|---|---|---|---|
| Open | Chua Ian | $379,500 |
Source: Public Records
Tax History
| Year | Tax Paid | Tax Assessment Tax Assessment Total Assessment is a certain percentage of the fair market value that is determined by local assessors to be the total taxable value of land and additions on the property. | Land | Improvement |
|---|---|---|---|---|
| 2025 | $10,240 | $884,886 | $442,443 | $442,443 |
| 2024 | $10,240 | $867,536 | $433,768 | $433,768 |
| 2023 | $10,135 | $850,526 | $425,263 | $425,263 |
| 2022 | $10,107 | $833,850 | $416,925 | $416,925 |
| 2021 | $9,861 | $817,500 | $408,750 | $408,750 |
| 2020 | $9,874 | $809,118 | $404,559 | $404,559 |
| 2019 | $9,459 | $793,254 | $396,627 | $396,627 |
| 2018 | $9,444 | $777,700 | $388,850 | $388,850 |
| 2017 | $8,976 | $762,452 | $381,226 | $381,226 |
| 2016 | $8,699 | $747,502 | $373,751 | $373,751 |
| 2015 | $8,449 | $736,274 | $368,137 | $368,137 |
| 2014 | $8,388 | $721,852 | $360,926 | $360,926 |
Source: Public Records
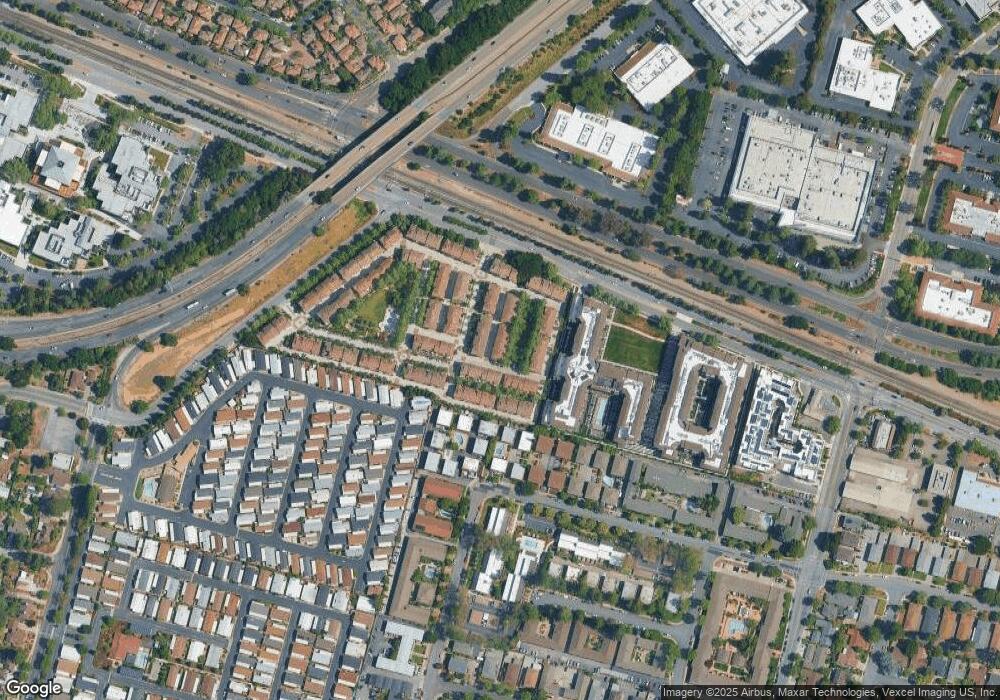
Map
Nearby Homes
- 451 Chagall St
- 325 Sylvan Ave Unit 23
- 325 Sylvan Ave
- 1241 Coronado Dr
- 433 Sylvan Ave Unit 120
- 433 Sylvan Ave Unit 84
- 433 Sylvan Ave Unit 134
- 1248 Cortez Dr
- 189 Bedford Loop Unit 82
- 365 Shelby Dr
- 171 Bel Air Ct
- 411 Hedgerow Ct
- 3102 Pyramid Way
- 159 Irene Ct
- 346 Circuit Way
- 501 Moorpark Way Unit 65
- 181 Ada Ave Unit 50
- 136 Avellino Way
- 994 La Mesa Terrace Unit F
- 992 Alpine Terrace Unit 5
- 232 Hockney Ave Unit 113
- 242 Hockney Ave Unit 114
- 226 Hockney Ave
- 241 Hockney Ave Unit 145
- 235 Hockney Ave Unit 144
- 222 Hockney Ave Unit 111
- 245 Hockney Ave
- 231 Hockney Ave
- 225 Hockney Ave
- 482 Kahlo St
- 484 Kahlo St
- 480 Kahlo St
- 216 Hockney Ave
- 221 Hockney Ave
- 474 Kahlo St
- 490 Kahlo St
- 472 Kahlo St
- 492 Kahlo St
- 235 Dali Ave Unit 102
- 231 Dali Ave
Your Personal Tour Guide
Ask me questions while you tour the home.