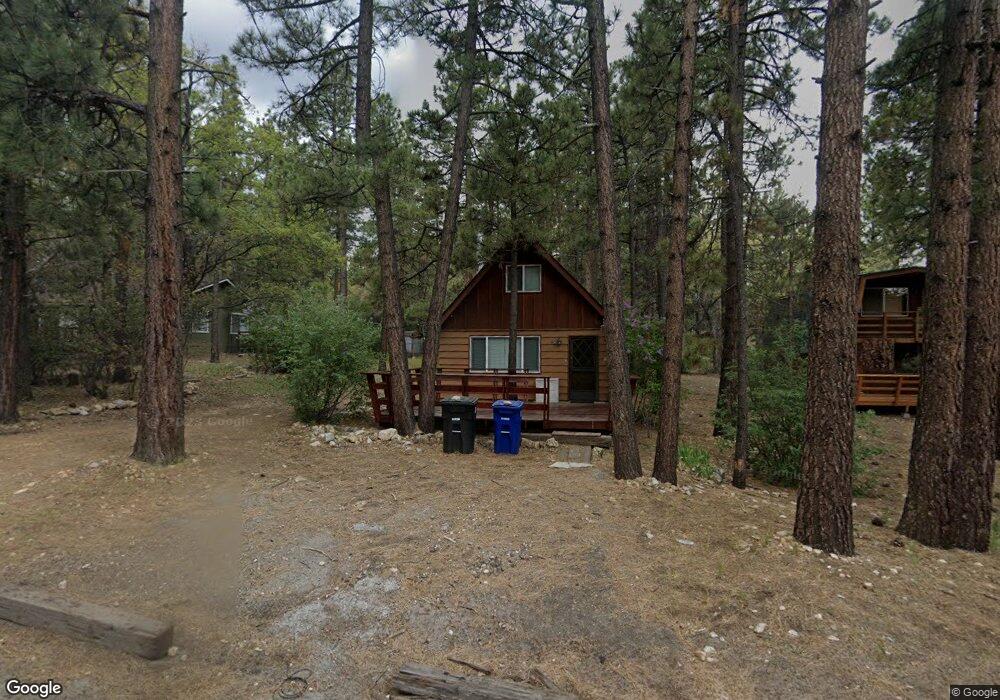
236 Maple Ln Sugarloaf, CA 92386
Estimated Value: $280,173 - $325,000
2
Beds
1
Bath
840
Sq Ft
$353/Sq Ft
Est. Value
About This Home
This home is located at 236 Maple Ln, Sugarloaf, CA 92386 and is currently estimated at $296,293, approximately $352 per square foot. 236 Maple Ln is a home with nearby schools including Baldwin Lane Elementary School, Big Bear Middle School, and Big Bear High School.
Ownership History
Date
Name
Owned For
Owner Type
Purchase Details
Closed on
Jul 28, 2015
Sold by
Pr Sedivy Jr George F
Bought by
Thackwell Bryan Keith and Matsubara Gayle Anne
Current Estimated Value
Purchase Details
Closed on
Jun 27, 2006
Sold by
Sedivy George
Bought by
Sedivy George F
Purchase Details
Closed on
Feb 13, 2006
Sold by
Cameron Donald Finlay and Cameron Lucille Marjorie
Bought by
Sedivy George
Purchase Details
Closed on
Mar 1, 1995
Sold by
Sedivy George F
Bought by
Sedivy George F
Create a Home Valuation Report for This Property
The Home Valuation Report is an in-depth analysis detailing your home's value as well as a comparison with similar homes in the area
Home Values in the Area
Average Home Value in this Area
Purchase History
| Date | Buyer | Sale Price | Title Company |
|---|---|---|---|
| Thackwell Bryan Keith | $121,500 | Wfg Title Company Of Ca | |
| Sedivy George F | -- | None Available | |
| Sedivy George | $20,000 | Commonwealth Land Title Co | |
| Sedivy George F | -- | -- |
Source: Public Records
Tax History
| Year | Tax Paid | Tax Assessment Tax Assessment Total Assessment is a certain percentage of the fair market value that is determined by local assessors to be the total taxable value of land and additions on the property. | Land | Improvement |
|---|---|---|---|---|
| 2025 | $2,797 | $143,834 | $28,768 | $115,066 |
| 2024 | $2,662 | $141,014 | $28,204 | $112,810 |
| 2023 | $2,567 | $138,249 | $27,651 | $110,598 |
| 2022 | $2,458 | $135,538 | $27,109 | $108,429 |
| 2021 | $2,400 | $132,880 | $26,577 | $106,303 |
| 2020 | $2,393 | $131,517 | $26,304 | $105,213 |
| 2019 | $2,337 | $128,938 | $25,788 | $103,150 |
| 2018 | $2,246 | $126,409 | $25,282 | $101,127 |
| 2017 | $2,182 | $123,930 | $24,786 | $99,144 |
| 2016 | $2,126 | $121,500 | $24,300 | $97,200 |
| 2015 | $2,227 | $113,981 | $44,130 | $69,851 |
| 2014 | $1,988 | $111,749 | $43,266 | $68,483 |
Source: Public Records
Map
Nearby Homes
Your Personal Tour Guide
Ask me questions while you tour the home.