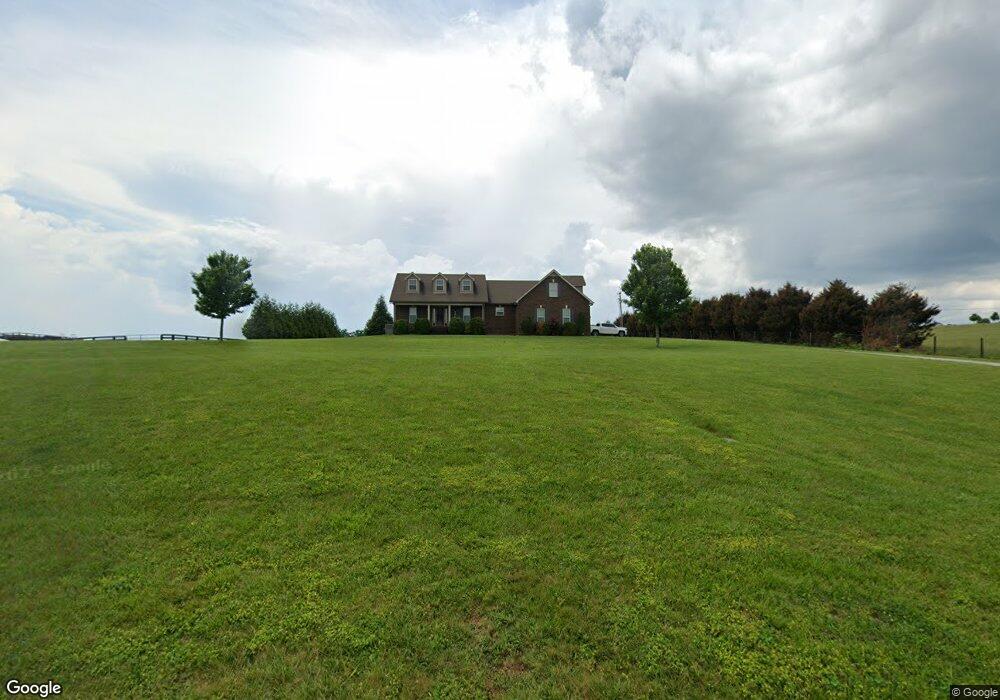
236 Naron Rd Shelbyville, TN 37160
Estimated Value: $529,326 - $564,000
--
Bed
1
Bath
2,423
Sq Ft
$226/Sq Ft
Est. Value
About This Home
This home is located at 236 Naron Rd, Shelbyville, TN 37160 and is currently estimated at $547,832, approximately $226 per square foot. 236 Naron Rd is a home with nearby schools including Liberty Elementary School.
Ownership History
Date
Name
Owned For
Owner Type
Purchase Details
Closed on
Aug 8, 2019
Sold by
Gregory Robbie Dale and Gregory Carrie Elizabeth
Bought by
King Ryan F and King Amanda D
Current Estimated Value
Home Financials for this Owner
Home Financials are based on the most recent Mortgage that was taken out on this home.
Original Mortgage
$304,000
Outstanding Balance
$265,836
Interest Rate
3.73%
Mortgage Type
New Conventional
Estimated Equity
$281,996
Purchase Details
Closed on
Jul 22, 2011
Sold by
Rice Michael A
Bought by
Gregory Robbie Dale and Gregory Carrie Elizabeth
Purchase Details
Closed on
Feb 21, 2008
Sold by
Krotje Pete
Bought by
Rice Michael A
Purchase Details
Closed on
Jun 20, 2006
Sold by
Roark Russell G
Bought by
Krotje Pete
Purchase Details
Closed on
Nov 27, 2002
Sold by
Stogner Shelton
Bought by
Roark Russell and Roark Shelia R
Create a Home Valuation Report for This Property
The Home Valuation Report is an in-depth analysis detailing your home's value as well as a comparison with similar homes in the area
Home Values in the Area
Average Home Value in this Area
Purchase History
| Date | Buyer | Sale Price | Title Company |
|---|---|---|---|
| King Ryan F | $320,000 | None Available | |
| Gregory Robbie Dale | $60,000 | -- | |
| Rice Michael A | $60,000 | -- | |
| Krotje Pete | $53,000 | -- | |
| Roark Russell | $46,500 | -- |
Source: Public Records
Mortgage History
| Date | Status | Borrower | Loan Amount |
|---|---|---|---|
| Open | King Ryan F | $304,000 |
Source: Public Records
Tax History Compared to Growth
Tax History
| Year | Tax Paid | Tax Assessment Tax Assessment Total Assessment is a certain percentage of the fair market value that is determined by local assessors to be the total taxable value of land and additions on the property. | Land | Improvement |
|---|---|---|---|---|
| 2025 | $2,255 | $96,975 | $0 | $0 |
| 2024 | $2,255 | $96,975 | $17,300 | $79,675 |
| 2023 | $2,255 | $96,975 | $17,300 | $79,675 |
| 2022 | $2,255 | $96,975 | $17,300 | $79,675 |
| 2021 | $1,906 | $96,975 | $17,300 | $79,675 |
| 2020 | $1,962 | $96,975 | $17,300 | $79,675 |
| 2019 | $1,962 | $73,750 | $10,775 | $62,975 |
| 2018 | $1,888 | $73,750 | $10,775 | $62,975 |
| 2017 | $1,888 | $73,750 | $10,775 | $62,975 |
| 2016 | $1,859 | $73,750 | $10,775 | $62,975 |
| 2015 | $1,859 | $73,750 | $10,775 | $62,975 |
| 2014 | $1,475 | $64,965 | $0 | $0 |
Source: Public Records
Map
Nearby Homes