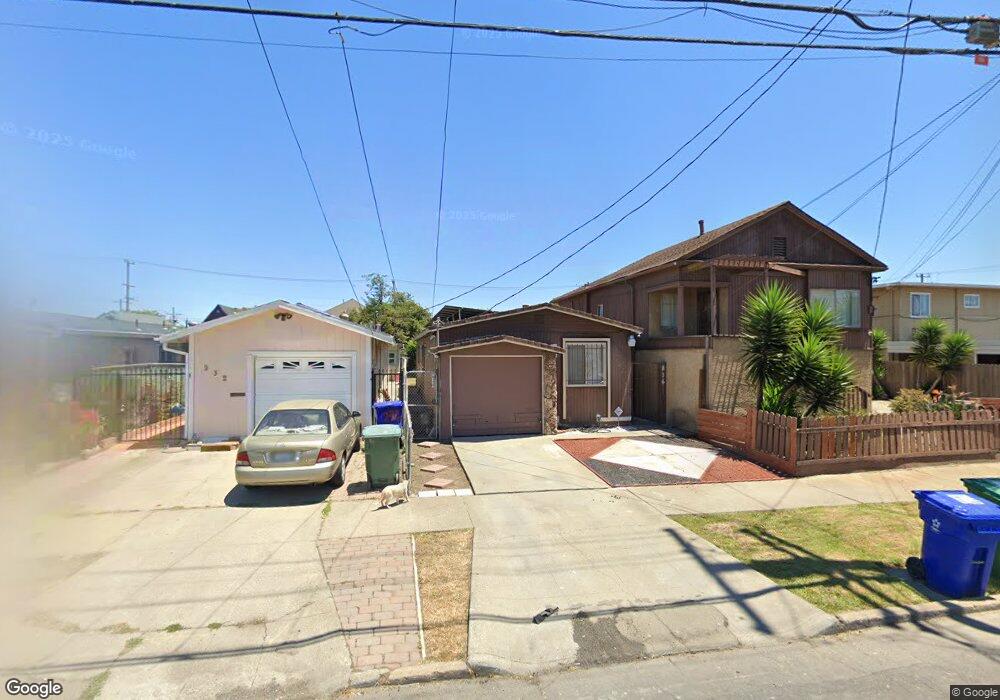
236 S 3rd St Richmond, CA 94804
Santa Fe NeighborhoodEstimated Value: $414,000 - $465,486
3
Beds
2
Baths
928
Sq Ft
$477/Sq Ft
Est. Value
About This Home
This home is located at 236 S 3rd St, Richmond, CA 94804 and is currently estimated at $442,372, approximately $476 per square foot. 236 S 3rd St is a home located in Contra Costa County with nearby schools including Nystrom Elementary School, Lovonya DeJean Middle School, and John F. Kennedy High School.
Ownership History
Date
Name
Owned For
Owner Type
Purchase Details
Closed on
Oct 19, 2017
Sold by
Jenkins Josephine M
Bought by
Lucas Shawn
Current Estimated Value
Home Financials for this Owner
Home Financials are based on the most recent Mortgage that was taken out on this home.
Original Mortgage
$270,019
Outstanding Balance
$225,300
Interest Rate
3.78%
Mortgage Type
FHA
Estimated Equity
$217,072
Purchase Details
Closed on
Jun 1, 2016
Sold by
Moore Josephine
Bought by
Jenkins Josephine M
Create a Home Valuation Report for This Property
The Home Valuation Report is an in-depth analysis detailing your home's value as well as a comparison with similar homes in the area
Home Values in the Area
Average Home Value in this Area
Purchase History
| Date | Buyer | Sale Price | Title Company |
|---|---|---|---|
| Lucas Shawn | $275,000 | Old Republic Title Company | |
| Jenkins Josephine M | -- | None Available |
Source: Public Records
Mortgage History
| Date | Status | Borrower | Loan Amount |
|---|---|---|---|
| Open | Lucas Shawn | $270,019 |
Source: Public Records
Tax History
| Year | Tax Paid | Tax Assessment Tax Assessment Total Assessment is a certain percentage of the fair market value that is determined by local assessors to be the total taxable value of land and additions on the property. | Land | Improvement |
|---|---|---|---|---|
| 2025 | $5,839 | $312,899 | $210,497 | $102,402 |
| 2024 | $5,654 | $306,765 | $206,370 | $100,395 |
| 2023 | $5,654 | $300,751 | $202,324 | $98,427 |
| 2022 | $5,533 | $294,855 | $198,357 | $96,498 |
| 2021 | $5,457 | $289,074 | $194,468 | $94,606 |
| 2019 | $5,120 | $280,500 | $188,700 | $91,800 |
| 2018 | $4,935 | $275,000 | $185,000 | $90,000 |
| 2017 | $1,587 | $32,421 | $6,663 | $25,758 |
| 2016 | $1,524 | $31,786 | $6,533 | $25,253 |
| 2015 | $1,479 | $31,309 | $6,435 | $24,874 |
| 2014 | $1,477 | $30,696 | $6,309 | $24,387 |
Source: Public Records
Map
Nearby Homes
Your Personal Tour Guide
Ask me questions while you tour the home.