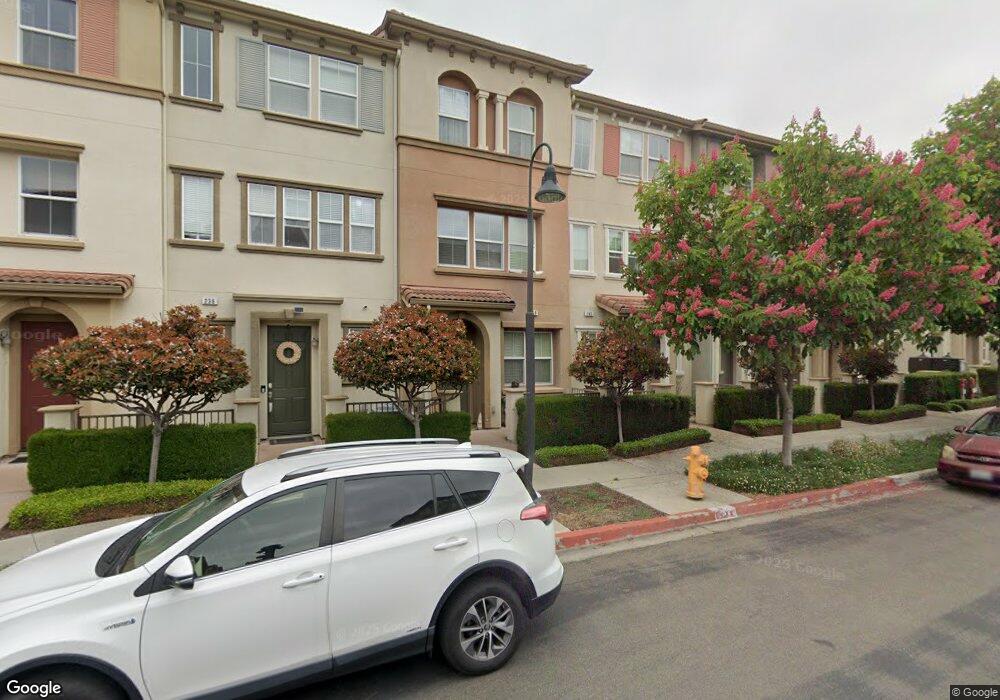
236 Sullivan Way Hayward, CA 94541
Burbank NeighborhoodEstimated Value: $787,000 - $816,000
3
Beds
3
Baths
1,651
Sq Ft
$485/Sq Ft
Est. Value
About This Home
This home is located at 236 Sullivan Way, Hayward, CA 94541 and is currently estimated at $801,444, approximately $485 per square foot. 236 Sullivan Way is a home located in Alameda County with nearby schools including Burbank Elementary School, Winton Middle School, and Hayward High School.
Ownership History
Date
Name
Owned For
Owner Type
Purchase Details
Closed on
Jun 21, 2018
Sold by
Scheid Jordan
Bought by
Scheid Krysten Ordonez
Current Estimated Value
Purchase Details
Closed on
Jun 18, 2018
Sold by
Ordonez Katherine S and Ordonez Krysten S
Bought by
Ordonez Katherine S and Scheid Krysten Ordonez
Purchase Details
Closed on
Dec 16, 2013
Sold by
Thomas Ruth
Bought by
Ordonez Katherine S and Ordonez Krysten S
Home Financials for this Owner
Home Financials are based on the most recent Mortgage that was taken out on this home.
Original Mortgage
$399,000
Outstanding Balance
$297,281
Interest Rate
4.13%
Mortgage Type
New Conventional
Estimated Equity
$504,163
Purchase Details
Closed on
Nov 4, 2010
Sold by
Kb Home South Bay Inc
Bought by
Thomas Ruth
Home Financials for this Owner
Home Financials are based on the most recent Mortgage that was taken out on this home.
Original Mortgage
$295,339
Interest Rate
4.75%
Mortgage Type
FHA
Purchase Details
Closed on
Aug 4, 2010
Sold by
Kb Home South Bay Inc
Bought by
Sienna At Parkside Owners Association
Create a Home Valuation Report for This Property
The Home Valuation Report is an in-depth analysis detailing your home's value as well as a comparison with similar homes in the area
Home Values in the Area
Average Home Value in this Area
Purchase History
| Date | Buyer | Sale Price | Title Company |
|---|---|---|---|
| Scheid Krysten Ordonez | -- | None Available | |
| Ordonez Katherine S | -- | None Available | |
| Ordonez Katherine S | $420,000 | First American Title Company | |
| Thomas Ruth | $303,500 | First American Title Company | |
| Sienna At Parkside Owners Association | -- | First American Title Company |
Source: Public Records
Mortgage History
| Date | Status | Borrower | Loan Amount |
|---|---|---|---|
| Open | Ordonez Katherine S | $399,000 | |
| Previous Owner | Thomas Ruth | $295,339 |
Source: Public Records
Tax History Compared to Growth
Tax History
| Year | Tax Paid | Tax Assessment Tax Assessment Total Assessment is a certain percentage of the fair market value that is determined by local assessors to be the total taxable value of land and additions on the property. | Land | Improvement |
|---|---|---|---|---|
| 2025 | $7,335 | $514,840 | $154,452 | $360,388 |
| 2024 | $7,335 | $504,747 | $151,424 | $353,323 |
| 2023 | $7,218 | $494,851 | $148,455 | $346,396 |
| 2022 | $7,075 | $485,150 | $145,545 | $339,605 |
| 2021 | $7,016 | $475,641 | $142,692 | $332,949 |
| 2020 | $6,949 | $470,764 | $141,229 | $329,535 |
| 2019 | $6,998 | $461,537 | $138,461 | $323,076 |
| 2018 | $6,626 | $452,490 | $135,747 | $316,743 |
| 2017 | $6,496 | $443,620 | $133,086 | $310,534 |
| 2016 | $6,178 | $434,921 | $130,476 | $304,445 |
| 2015 | $6,073 | $428,391 | $128,517 | $299,874 |
| 2014 | $5,605 | $420,000 | $126,000 | $294,000 |
Source: Public Records
Map
Nearby Homes
- 252 Sullivan Way
- 273 Sullivan Way
- 2050 Jubilee Dr
- 414 Palmer Ave
- 1042 Old Oak Ln
- 1110 Red Wing Dr
- 610 Staley Ave
- 626 Moss Way
- 622 Moss Way
- 589 Staley Ave
- 200 Old Oak Ln Unit 3
- 2315 Gibbons St
- 266 Smalley Ave
- 350 Smalley Ave
- 22939 Santa Clara St
- 22592 Sonoma St
- 439 Holly Ln
- 353 Laurel Ave Unit 15
- 357 Laurel Ave Unit 4
- 188 Laurel Ave
- 234 Sullivan Way Unit 618
- 238 Sullivan Way
- 240 Sullivan Way Unit 621
- 242 Sullivan Way
- 246 Sullivan Way
- 1052 Martin Luther King Dr
- 202 Sullivan Way Unit 589
- 204 Sullivan Way
- 206 Sullivan Way
- 208 Sullivan Way
- 210 Sullivan Way
- 212 Sullivan Way
- 1032 Martin Luther King Dr
- 1030 Martin Luther King Dr
- 1026 Martin Luther King Dr
- 1034 Martin Luther King Dr
- 245 Sullivan Way
- 1056 Martin Luther King Dr
- 1054 Martin Luther King Dr
- 257 Sullivan Way