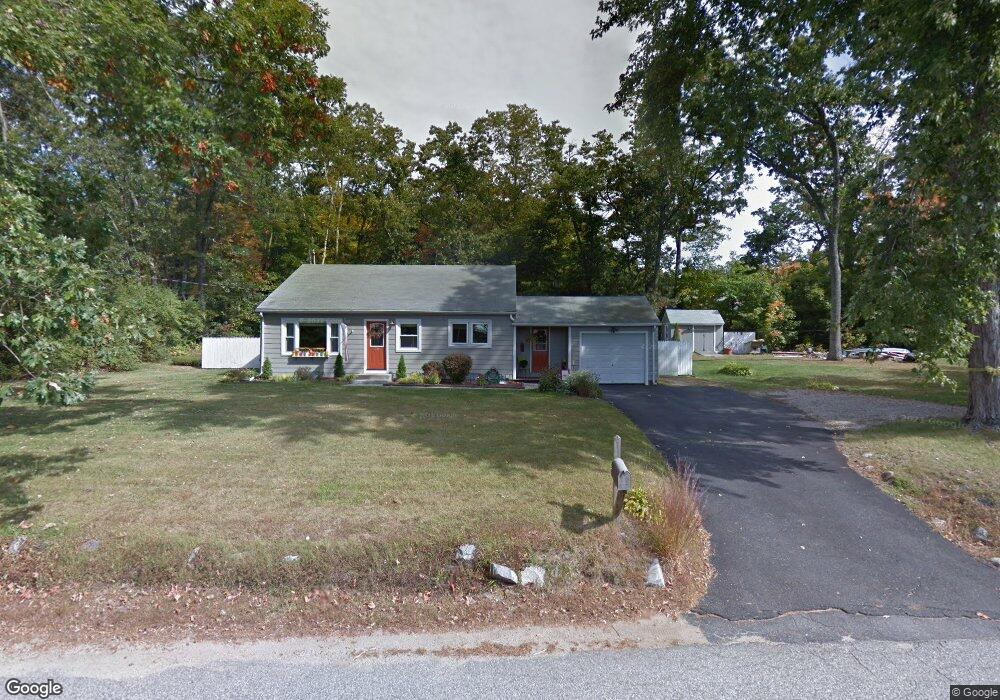
236 Thompson St Palmer, MA 01069
Estimated Value: $285,000 - $331,000
3
Beds
1
Bath
1,080
Sq Ft
$288/Sq Ft
Est. Value
About This Home
This home is located at 236 Thompson St, Palmer, MA 01069 and is currently estimated at $311,106, approximately $288 per square foot. 236 Thompson St is a home located in Hampden County with nearby schools including Old Mill Pond Elementary School, Converse Middle School, and Palmer High School.
Ownership History
Date
Name
Owned For
Owner Type
Purchase Details
Closed on
Jul 1, 1998
Sold by
Est Mccomb Theresa L and Mccomb Eugene M
Bought by
Marini Joseph J and Marini Susan J
Current Estimated Value
Home Financials for this Owner
Home Financials are based on the most recent Mortgage that was taken out on this home.
Original Mortgage
$85,500
Outstanding Balance
$17,558
Interest Rate
7.04%
Mortgage Type
Purchase Money Mortgage
Estimated Equity
$293,548
Create a Home Valuation Report for This Property
The Home Valuation Report is an in-depth analysis detailing your home's value as well as a comparison with similar homes in the area
Home Values in the Area
Average Home Value in this Area
Purchase History
| Date | Buyer | Sale Price | Title Company |
|---|---|---|---|
| Marini Joseph J | $95,000 | -- |
Source: Public Records
Mortgage History
| Date | Status | Borrower | Loan Amount |
|---|---|---|---|
| Open | Marini Joseph J | $25,000 | |
| Open | Marini Joseph J | $85,500 | |
| Previous Owner | Marini Joseph J | $45,000 |
Source: Public Records
Tax History Compared to Growth
Tax History
| Year | Tax Paid | Tax Assessment Tax Assessment Total Assessment is a certain percentage of the fair market value that is determined by local assessors to be the total taxable value of land and additions on the property. | Land | Improvement |
|---|---|---|---|---|
| 2025 | $4,470 | $246,300 | $67,800 | $178,500 |
| 2024 | $4,176 | $223,700 | $61,600 | $162,100 |
| 2023 | $4,073 | $209,500 | $61,600 | $147,900 |
| 2022 | $3,833 | $179,100 | $54,100 | $125,000 |
| 2021 | $3,818 | $168,700 | $59,700 | $109,000 |
| 2020 | $3,707 | $162,600 | $59,700 | $102,900 |
| 2019 | $3,600 | $162,600 | $59,700 | $102,900 |
| 2018 | $3,489 | $158,000 | $58,000 | $100,000 |
| 2017 | $3,408 | $158,000 | $58,000 | $100,000 |
| 2016 | $3,265 | $153,500 | $56,400 | $97,100 |
| 2015 | $3,167 | $153,500 | $56,400 | $97,100 |
Source: Public Records
Map
Nearby Homes
- 98 Mason St
- 135 Thompson St
- 7 Cedar Hill St
- 0 Flynt St
- 36 Washington Rd
- 190 Dunhamtown Palmer Rd
- 52 Washington Rd
- 1415 Park St
- 60 Beech St
- Lot 3 Washington Rd
- 11 Allen St
- 207 Breckenridge St
- 160 Breckenridge St
- Lot 8 Breckenridge St
- 10 Willow Cir
- 1 Willow Cir
- 268 Palmer Rd Unit 59
- 268 Palmer Rd Unit 44
- 268 Palmer Rd Unit 27
- 268 Palmer Rd Unit 2