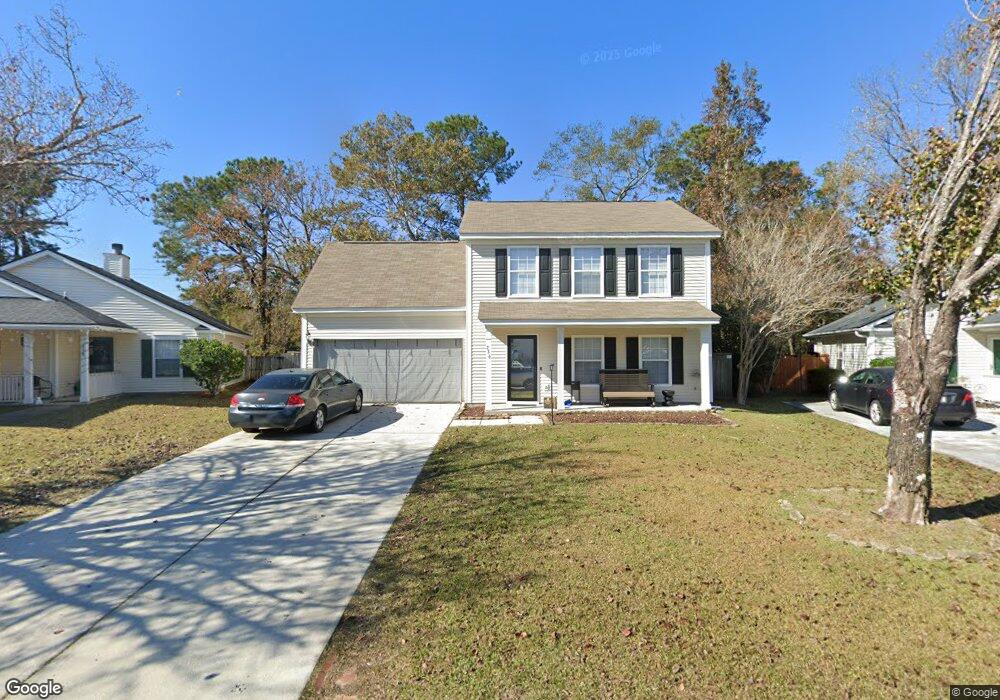
236 Two Pond Loop Ladson, SC 29456
Estimated Value: $296,000 - $331,000
4
Beds
3
Baths
1,582
Sq Ft
$199/Sq Ft
Est. Value
About This Home
This home is located at 236 Two Pond Loop, Ladson, SC 29456 and is currently estimated at $314,408, approximately $198 per square foot. 236 Two Pond Loop is a home located in Dorchester County with nearby schools including Joseph R. Pye Elementary, Oakbrook Middle School, and Ashley Ridge High School.
Ownership History
Date
Name
Owned For
Owner Type
Purchase Details
Closed on
Dec 5, 2025
Sold by
White David R and White Deana D
Bought by
White David R and White Shawntorria Q
Current Estimated Value
Home Financials for this Owner
Home Financials are based on the most recent Mortgage that was taken out on this home.
Original Mortgage
$200,000
Interest Rate
6.16%
Mortgage Type
VA
Purchase Details
Closed on
May 27, 2009
Sold by
U S Bank National Association
Bought by
White David R and White Deana D
Home Financials for this Owner
Home Financials are based on the most recent Mortgage that was taken out on this home.
Original Mortgage
$126,564
Interest Rate
4.77%
Mortgage Type
FHA
Purchase Details
Closed on
Jan 8, 2009
Sold by
Labruyere Justin and Labruyere Ashley
Bought by
U S Bank National Association
Purchase Details
Closed on
Aug 22, 2006
Sold by
Welsh Brian J and Welsh Jacqueline G B
Bought by
Labruyere Justin and Labruyere Ashley
Home Financials for this Owner
Home Financials are based on the most recent Mortgage that was taken out on this home.
Original Mortgage
$33,600
Interest Rate
6.67%
Mortgage Type
Stand Alone Second
Create a Home Valuation Report for This Property
The Home Valuation Report is an in-depth analysis detailing your home's value as well as a comparison with similar homes in the area
Home Values in the Area
Average Home Value in this Area
Purchase History
| Date | Buyer | Sale Price | Title Company |
|---|---|---|---|
| White David R | -- | Equity First Title | |
| White David R | $128,900 | -- | |
| U S Bank National Association | $2,500 | -- | |
| Labruyere Justin | $169,000 | None Available |
Source: Public Records
Mortgage History
| Date | Status | Borrower | Loan Amount |
|---|---|---|---|
| Previous Owner | White David R | $200,000 | |
| Previous Owner | White David R | $126,564 | |
| Previous Owner | Labruyere Justin | $33,600 | |
| Previous Owner | Labruyere Justin | $134,400 |
Source: Public Records
Tax History
| Year | Tax Paid | Tax Assessment Tax Assessment Total Assessment is a certain percentage of the fair market value that is determined by local assessors to be the total taxable value of land and additions on the property. | Land | Improvement |
|---|---|---|---|---|
| 2025 | $2,013 | $12,222 | $4,560 | $7,662 |
| 2024 | $2,013 | $12,222 | $4,560 | $7,662 |
| 2023 | $2,013 | $7,820 | $1,600 | $6,220 |
| 2022 | $1,637 | $6,840 | $1,380 | $5,460 |
| 2021 | $1,738 | $6,840 | $1,380 | $5,460 |
| 2020 | $1,613 | $5,950 | $1,200 | $4,750 |
| 2019 | $1,575 | $5,950 | $1,200 | $4,750 |
| 2018 | $1,396 | $5,950 | $1,200 | $4,750 |
| 2017 | $1,369 | $5,950 | $1,200 | $4,750 |
| 2016 | $1,349 | $5,950 | $1,200 | $4,750 |
| 2015 | $1,351 | $5,950 | $1,200 | $4,750 |
| 2014 | $1,352 | $152,100 | $0 | $0 |
| 2013 | -- | $6,080 | $0 | $0 |
Source: Public Records
Map
Nearby Homes
- 206 Limehouse Dr
- 120 Two Pond Loop
- 224 Withers Ln
- 218 Withers Ln
- 9875 Jamison Rd
- 202 Elliott Dr
- 217 Beverly Dr
- 208 Terrace View Dr
- 9631 Crosscut Dr
- 203 Terrace View Dr
- 9658 Jamison Rd
- 117 Alwyn Blvd
- 1001 Margaret Dr
- 101 Wood Side Dr
- 201 Ibis Dr
- 111 Jarett Rd
- 203 Ibis Dr
- 52 Regency Oaks Dr
- 91 Cross Timbers Dr
- 43 Regency Oaks Dr
- 234 Two Pond Loop
- 238 Two Pond Loop
- 127 Limehouse Dr
- 232 Two Pond Loop
- 240 Two Pond Loop
- 237 Two Pond Loop
- 109 Joyce Ct
- 125 Limehouse Dr
- 227 Two Pond Loop
- 230 Two Pond Loop
- 243 Two Pond Loop
- 244 Two Pond Loop
- 101 Barbara Dr
- 107 Joyce Ct
- 226 Two Pond Loop
- 221 Two Pond Loop
- 245 Two Pond Loop
- 123 Limehouse Dr
- 246 Two Pond Loop
- 222 Two Pond Loop
Your Personal Tour Guide
Ask me questions while you tour the home.