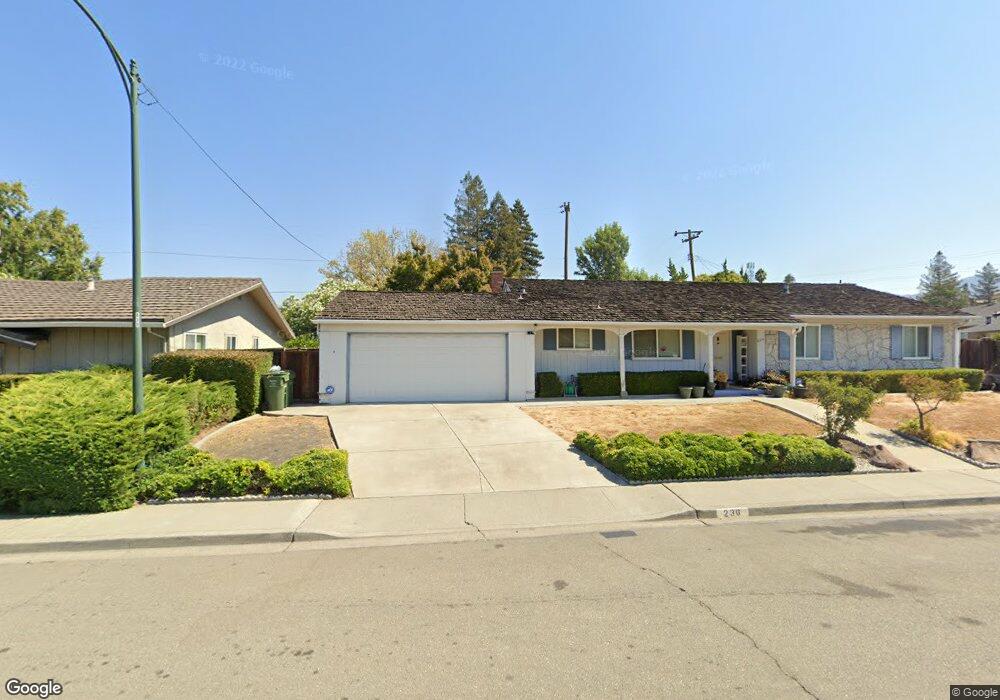
236 Via Monte Walnut Creek, CA 94598
Northgate NeighborhoodEstimated Value: $1,329,354 - $1,576,000
3
Beds
2
Baths
1,655
Sq Ft
$852/Sq Ft
Est. Value
About This Home
This home is located at 236 Via Monte, Walnut Creek, CA 94598 and is currently estimated at $1,409,839, approximately $851 per square foot. 236 Via Monte is a home located in Contra Costa County with nearby schools including Walnut Acres Elementary School, Foothill Middle School, and Northgate High School.
Ownership History
Date
Name
Owned For
Owner Type
Purchase Details
Closed on
Sep 13, 2017
Sold by
Feng Wen Zhao and Guan Wan Chang
Bought by
Feng Wen Zhao and Guan Wan Chang
Current Estimated Value
Purchase Details
Closed on
Nov 18, 2016
Sold by
Ho Charles Tatming and Ho Pauline Hom
Bought by
Guan Wan Chang and Feng Wen Zhao
Home Financials for this Owner
Home Financials are based on the most recent Mortgage that was taken out on this home.
Original Mortgage
$480,000
Outstanding Balance
$385,963
Interest Rate
3.47%
Mortgage Type
New Conventional
Estimated Equity
$1,023,876
Purchase Details
Closed on
Feb 15, 2002
Sold by
Scarpace James J
Bought by
Ho Charles Tatming and Ho Pauline Hom
Home Financials for this Owner
Home Financials are based on the most recent Mortgage that was taken out on this home.
Original Mortgage
$286,000
Interest Rate
7.04%
Mortgage Type
Purchase Money Mortgage
Create a Home Valuation Report for This Property
The Home Valuation Report is an in-depth analysis detailing your home's value as well as a comparison with similar homes in the area
Home Values in the Area
Average Home Value in this Area
Purchase History
| Date | Buyer | Sale Price | Title Company |
|---|---|---|---|
| Feng Wen Zhao | -- | None Available | |
| Guan Wan Chang | $710,000 | First American Title Company | |
| Ho Charles Tatming | $495,000 | Chicago Title Co |
Source: Public Records
Mortgage History
| Date | Status | Borrower | Loan Amount |
|---|---|---|---|
| Open | Guan Wan Chang | $480,000 | |
| Previous Owner | Ho Charles Tatming | $286,000 |
Source: Public Records
Tax History Compared to Growth
Tax History
| Year | Tax Paid | Tax Assessment Tax Assessment Total Assessment is a certain percentage of the fair market value that is determined by local assessors to be the total taxable value of land and additions on the property. | Land | Improvement |
|---|---|---|---|---|
| 2025 | $10,566 | $899,448 | $731,166 | $168,282 |
| 2024 | $10,396 | $881,813 | $716,830 | $164,983 |
| 2023 | $10,396 | $864,524 | $702,775 | $161,749 |
| 2022 | $10,306 | $847,574 | $688,996 | $158,578 |
| 2021 | $10,078 | $830,956 | $675,487 | $155,469 |
| 2019 | $9,869 | $806,310 | $655,452 | $150,858 |
| 2018 | $9,514 | $790,500 | $642,600 | $147,900 |
| 2017 | $9,215 | $775,000 | $630,000 | $145,000 |
| 2016 | $7,432 | $617,717 | $461,731 | $155,986 |
| 2015 | $7,378 | $608,439 | $454,796 | $153,643 |
| 2014 | $7,280 | $596,522 | $445,888 | $150,634 |
Source: Public Records
Map
Nearby Homes
- 3067 Stinson Cir
- 206 Hamlin Loop
- 401 Seville Ln
- 3318 Ellesmere Ct
- 817 Cheyenne Dr
- 2890 Treat Blvd Unit 5
- 1053 Arkell Rd
- 3051 Treat Blvd Unit 129
- 3055 Treat Blvd Unit 36
- 2830 Royal Ann Ln
- 2840 Royal Ann Ln
- 1032 Millbrook Ct
- 1031 Millbrook Ct
- 825 Oak Grove Rd Unit 46
- 567 Cabot Ct
- 3171 Lippizaner Ln
- 1936 Nero Ct
- 788 Woodwind Place
- 165 Pine Creek Rd
- 1960 Pomar Way
- 226 Via Monte
- 246 Via Monte
- 229 Paloma Corte
- 2818 Grande Camino
- 239 Paloma Corte
- 237 Via Monte
- 225 Via Monte
- 216 Via Monte
- 2766 Grande Camino
- 2828 Grande Camino
- 219 Paloma Corte
- 213 Via Monte
- 182 Venado Corte
- 240 Paloma Corte
- 268 Via Monte
- 2756 Grande Camino
- 2805 Encina Camino
- 2817 Grande Camino
- 2838 Grande Camino
- 2817 Encina Camino