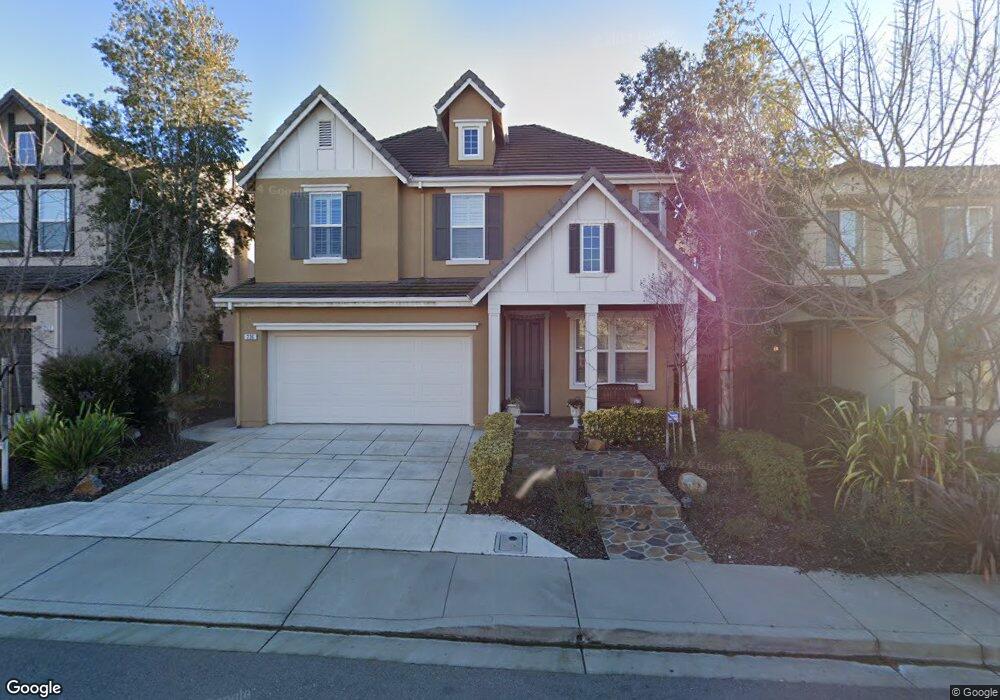
236 Wimbledon Ct San Ramon, CA 94582
Gale Ranch-Windemere NeighborhoodEstimated Value: $1,779,729 - $1,952,000
4
Beds
3
Baths
2,275
Sq Ft
$829/Sq Ft
Est. Value
About This Home
This home is located at 236 Wimbledon Ct, San Ramon, CA 94582 and is currently estimated at $1,885,432, approximately $828 per square foot. 236 Wimbledon Ct is a home located in Contra Costa County with nearby schools including Hidden Hills Elementary School, Windemere Ranch Middle School, and Dougherty Valley High School.
Ownership History
Date
Name
Owned For
Owner Type
Purchase Details
Closed on
Feb 5, 2021
Sold by
Sharma Deepak and Sharma Shraddha
Bought by
Sharma Deepak and Sharma Shraddha
Current Estimated Value
Home Financials for this Owner
Home Financials are based on the most recent Mortgage that was taken out on this home.
Original Mortgage
$226,500
Outstanding Balance
$202,228
Interest Rate
2.6%
Mortgage Type
New Conventional
Estimated Equity
$1,683,204
Purchase Details
Closed on
Dec 11, 2019
Sold by
Sharma Deepak and Sharma Shraddha
Bought by
Sharma Deepak and Sharma Shraddha
Purchase Details
Closed on
Apr 4, 2008
Sold by
Brookfield Campton Llc
Bought by
Sharma Deepak and Sharma Shraddha
Home Financials for this Owner
Home Financials are based on the most recent Mortgage that was taken out on this home.
Original Mortgage
$417,000
Interest Rate
5.99%
Mortgage Type
Purchase Money Mortgage
Create a Home Valuation Report for This Property
The Home Valuation Report is an in-depth analysis detailing your home's value as well as a comparison with similar homes in the area
Home Values in the Area
Average Home Value in this Area
Purchase History
| Date | Buyer | Sale Price | Title Company |
|---|---|---|---|
| Sharma Deepak | -- | State Title Inc San Fra | |
| Sharma Deepak | -- | States Title Fts Agency | |
| Sharma Deepak | -- | None Available | |
| Sharma Deepak | $765,000 | First American Title Company |
Source: Public Records
Mortgage History
| Date | Status | Borrower | Loan Amount |
|---|---|---|---|
| Open | Sharma Deepak | $226,500 | |
| Closed | Sharma Deepak | $417,000 |
Source: Public Records
Tax History Compared to Growth
Tax History
| Year | Tax Paid | Tax Assessment Tax Assessment Total Assessment is a certain percentage of the fair market value that is determined by local assessors to be the total taxable value of land and additions on the property. | Land | Improvement |
|---|---|---|---|---|
| 2025 | $16,064 | $1,004,831 | $449,218 | $555,613 |
| 2024 | $15,855 | $985,129 | $440,410 | $544,719 |
| 2023 | $15,855 | $965,814 | $431,775 | $534,039 |
| 2022 | $15,532 | $946,877 | $423,309 | $523,568 |
| 2021 | $15,187 | $928,311 | $415,009 | $513,302 |
| 2019 | $14,844 | $900,778 | $402,700 | $498,078 |
| 2018 | $14,390 | $883,116 | $394,804 | $488,312 |
| 2017 | $14,304 | $865,801 | $387,063 | $478,738 |
| 2016 | $14,242 | $848,825 | $379,474 | $469,351 |
| 2015 | $14,053 | $836,075 | $373,774 | $462,301 |
| 2014 | $13,944 | $819,699 | $366,453 | $453,246 |
Source: Public Records
Map
Nearby Homes
- 5132 Fioli Loop
- 5300 Fioli Loop
- 3221 Browntail Way
- 1236 Andreas Way
- 1412 Arianna Ln
- 406 Glastonbury Ct
- 2073 Watermill Rd
- 1615 Lawrence Rd
- 224 Riverland Ct
- 1038 S Monarch Rd
- 6260 Main Branch Rd
- 1610 Lawrence Rd
- 2165 Watermill Rd Unit 54
- 3056 Silva Way
- 3638 Sandalford Way
- 6132 Alpine Blue Dr
- 3422 Cinnamon Ridge Rd
- 2308 Cedarwood Loop
- 41 Meadow Lake Dr
- 1628 Banbury Dr
- 228 Wimbledon Ct
- 252 Wimbledon Ct
- 222 Wimbledon Ct
- 165 Paddington Ct
- 258 Wimbledon Ct
- 171 Paddington Ct
- 159 Paddington Ct
- 216 Wimbledon Ct
- 237 Wimbledon Ct
- 229 Wimbledon Ct
- 251 Wimbledon Ct
- 5098 Fioli Loop Unit 29
- 223 Wimbledon Ct
- 153 Paddington Ct
- 5112 Fioli Loop
- 5096 Fioli Loop
- 5082 Fioli Loop
- 257 Wimbledon Ct
- 208 Wimbledon Ct
- 217 Wimbledon Ct