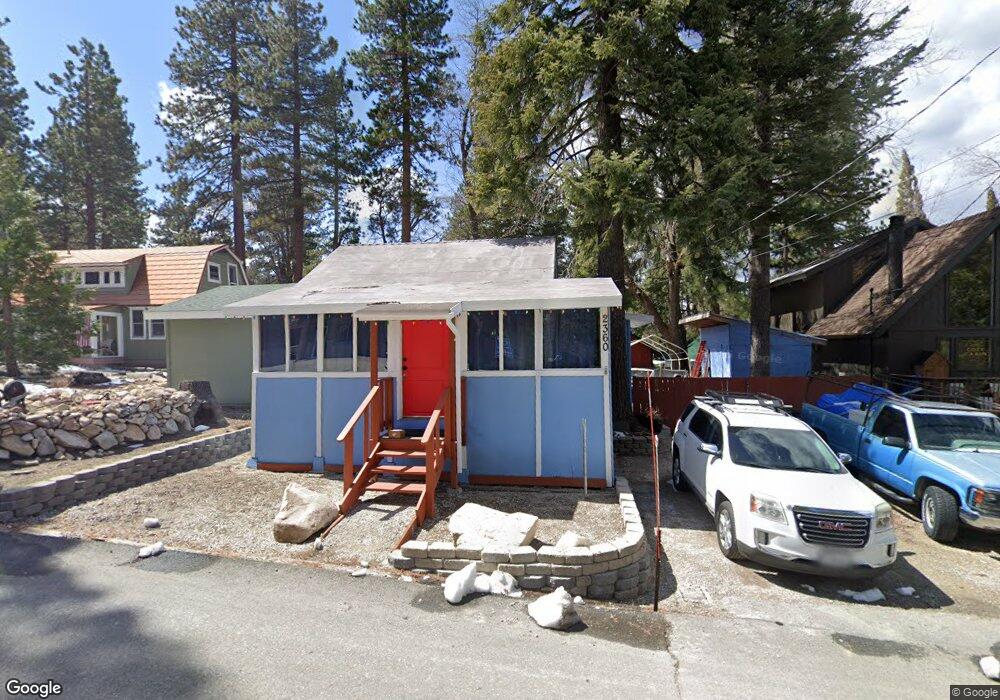
2360 Fir Dr Running Springs, CA 92382
Estimated Value: $208,445 - $277,000
1
Bed
1
Bath
504
Sq Ft
$490/Sq Ft
Est. Value
About This Home
This home is located at 2360 Fir Dr, Running Springs, CA 92382 and is currently estimated at $247,111, approximately $490 per square foot. 2360 Fir Dr is a home with nearby schools including Charles Hoffman Elementary School, Mary P. Henck Intermediate School, and Rim Of The World Senior High School.
Ownership History
Date
Name
Owned For
Owner Type
Purchase Details
Closed on
Nov 25, 1996
Sold by
Schmid Elizabeth M
Bought by
Munoz Steven R and Munoz Patricia J
Current Estimated Value
Home Financials for this Owner
Home Financials are based on the most recent Mortgage that was taken out on this home.
Original Mortgage
$49,000
Outstanding Balance
$4,931
Interest Rate
7.59%
Mortgage Type
Seller Take Back
Estimated Equity
$242,180
Create a Home Valuation Report for This Property
The Home Valuation Report is an in-depth analysis detailing your home's value as well as a comparison with similar homes in the area
Home Values in the Area
Average Home Value in this Area
Purchase History
| Date | Buyer | Sale Price | Title Company |
|---|---|---|---|
| Munoz Steven R | $51,000 | Commonwealth Land Title Co |
Source: Public Records
Mortgage History
| Date | Status | Borrower | Loan Amount |
|---|---|---|---|
| Open | Munoz Steven R | $49,000 |
Source: Public Records
Tax History Compared to Growth
Tax History
| Year | Tax Paid | Tax Assessment Tax Assessment Total Assessment is a certain percentage of the fair market value that is determined by local assessors to be the total taxable value of land and additions on the property. | Land | Improvement |
|---|---|---|---|---|
| 2025 | $1,683 | $83,059 | $13,028 | $70,031 |
| 2024 | $1,683 | $81,431 | $12,773 | $68,658 |
| 2023 | $1,182 | $79,835 | $12,523 | $67,312 |
| 2022 | $1,611 | $78,269 | $12,277 | $65,992 |
| 2021 | $1,593 | $76,734 | $12,036 | $64,698 |
| 2020 | $1,583 | $75,948 | $11,913 | $64,035 |
| 2019 | $1,534 | $74,458 | $11,679 | $62,779 |
| 2018 | $1,472 | $72,998 | $11,450 | $61,548 |
| 2017 | $1,464 | $71,566 | $11,225 | $60,341 |
| 2016 | $1,407 | $70,163 | $11,005 | $59,158 |
| 2015 | $1,401 | $69,109 | $10,840 | $58,269 |
| 2014 | $1,375 | $67,756 | $10,628 | $57,128 |
Source: Public Records
Map
Nearby Homes