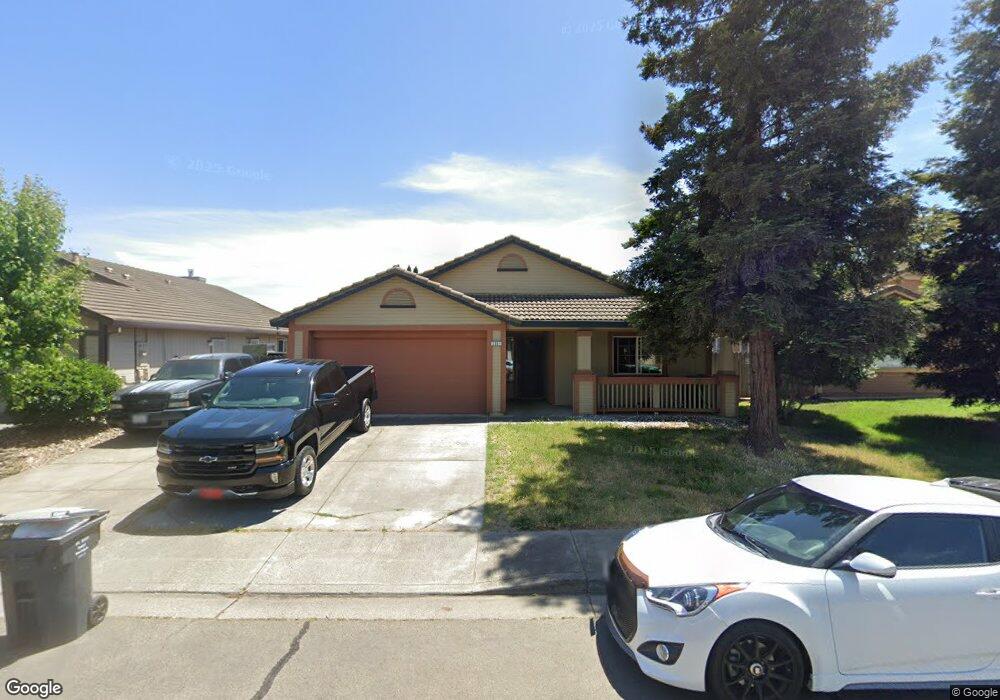
2361 Burgundy Way Fairfield, CA 94533
Estimated Value: $470,000 - $552,000
3
Beds
2
Baths
1,413
Sq Ft
$364/Sq Ft
Est. Value
About This Home
This home is located at 2361 Burgundy Way, Fairfield, CA 94533 and is currently estimated at $514,921, approximately $364 per square foot. 2361 Burgundy Way is a home located in Solano County with nearby schools including Crystal Middle School, Armijo High School, and We R Family Christian School.
Ownership History
Date
Name
Owned For
Owner Type
Purchase Details
Closed on
Apr 20, 2012
Sold by
Arriaga Alejandro and Arriaga Esperanza
Bought by
Yeung Kam Ping Au and Chu Ngan Kwan
Current Estimated Value
Purchase Details
Closed on
May 29, 2002
Sold by
Siller Pamela
Bought by
Arriaga Alejandro and Arriaga Esperanza
Home Financials for this Owner
Home Financials are based on the most recent Mortgage that was taken out on this home.
Original Mortgage
$204,000
Interest Rate
6.89%
Purchase Details
Closed on
Jan 30, 2000
Sold by
Siller Pamela K
Bought by
Siller Pamela
Purchase Details
Closed on
Oct 24, 1995
Sold by
Hph Homebuilders 1995 Lp
Bought by
Siller Pamela K
Home Financials for this Owner
Home Financials are based on the most recent Mortgage that was taken out on this home.
Original Mortgage
$136,885
Interest Rate
7.42%
Create a Home Valuation Report for This Property
The Home Valuation Report is an in-depth analysis detailing your home's value as well as a comparison with similar homes in the area
Home Values in the Area
Average Home Value in this Area
Purchase History
| Date | Buyer | Sale Price | Title Company |
|---|---|---|---|
| Yeung Kam Ping Au | $143,000 | North American Title Co Inc | |
| Arriaga Alejandro | $255,000 | Placer Title Company | |
| Siller Pamela | -- | -- | |
| Siller Pamela K | $144,500 | Chicago Title Co |
Source: Public Records
Mortgage History
| Date | Status | Borrower | Loan Amount |
|---|---|---|---|
| Previous Owner | Arriaga Alejandro | $204,000 | |
| Previous Owner | Siller Pamela K | $136,885 |
Source: Public Records
Tax History Compared to Growth
Tax History
| Year | Tax Paid | Tax Assessment Tax Assessment Total Assessment is a certain percentage of the fair market value that is determined by local assessors to be the total taxable value of land and additions on the property. | Land | Improvement |
|---|---|---|---|---|
| 2025 | $2,026 | $179,605 | $94,199 | $85,406 |
| 2024 | $2,026 | $176,084 | $92,352 | $83,732 |
| 2023 | $1,965 | $172,633 | $90,542 | $82,091 |
| 2022 | $1,983 | $169,249 | $88,766 | $80,483 |
| 2021 | $1,964 | $165,931 | $87,026 | $78,905 |
| 2020 | $2,102 | $164,230 | $86,134 | $78,096 |
| 2019 | $2,057 | $161,011 | $84,446 | $76,565 |
| 2018 | $2,115 | $157,855 | $82,791 | $75,064 |
| 2017 | $2,155 | $154,761 | $81,168 | $73,593 |
| 2016 | $2,135 | $151,727 | $79,577 | $72,150 |
| 2015 | $2,017 | $149,449 | $78,382 | $71,067 |
| 2014 | $2,002 | $146,522 | $76,847 | $69,675 |
Source: Public Records
Map
Nearby Homes
- 435 Hamilton Dr
- 2537 Woolner Ave
- 266 De Soto Dr
- 113 Creek View Cir
- 109 Creek View Cir
- 1625 Park Ln Unit 11
- 1842 Minnesota St
- 1007 4th St
- 1661 Minnesota St
- 2685 Rockville Rd
- 225 Pennsylvania Ave Unit B5
- 3451 Astoria Cir
- 1731 Michigan St
- 1200 Truman St
- 3418 Astoria Ct
- 1042 Hayes St
- 1137 Ohio St
- 2626 Rockville Rd
- 527 Great Jones St
- 1201 Missouri St
- 2355 Burgundy Way
- 2367 Burgundy Way
- 2349 Burgundy Way
- 2373 Burgundy Way
- 2343 Burgundy Way
- 2379 Burgundy Way
- 2364 Burgundy Way
- 2358 Burgundy Way
- 2370 Burgundy Way
- 2352 Burgundy Way
- 2376 Burgundy Way
- 2337 Burgundy Way
- 2346 Burgundy Way
- 2385 Burgundy Way
- 2340 Burgundy Way
- 2331 Burgundy Way
- 2391 Burgundy Way
- 2390 Burgundy Way