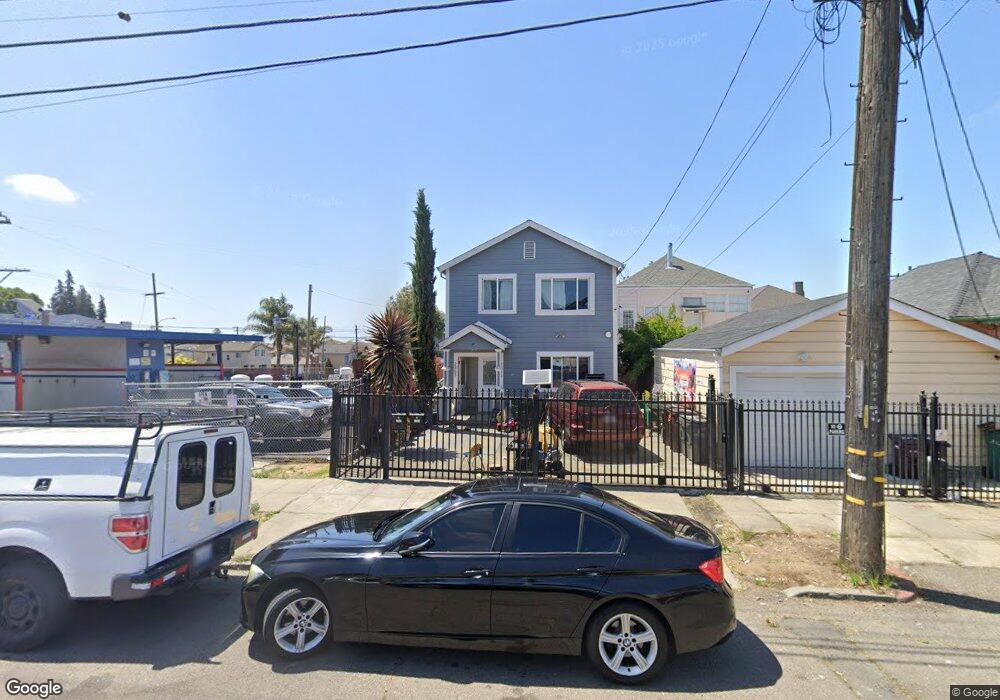
2361 E 17th St Oakland, CA 94601
Meadow Brook NeighborhoodEstimated Value: $715,000 - $984,021
6
Beds
4
Baths
2,900
Sq Ft
$301/Sq Ft
Est. Value
About This Home
This home is located at 2361 E 17th St, Oakland, CA 94601 and is currently estimated at $872,255, approximately $300 per square foot. 2361 E 17th St is a home located in Alameda County with nearby schools including Garfield Elementary School, Roosevelt Middle School, and Fremont High School.
Ownership History
Date
Name
Owned For
Owner Type
Purchase Details
Closed on
Feb 13, 2018
Sold by
Quach Alex
Bought by
Kc Holdings Llc
Current Estimated Value
Purchase Details
Closed on
Mar 25, 2016
Sold by
Pham Lam Phat D and Pham Lam Nghia
Bought by
Quach Alex
Home Financials for this Owner
Home Financials are based on the most recent Mortgage that was taken out on this home.
Original Mortgage
$80,000
Interest Rate
3.65%
Mortgage Type
Purchase Money Mortgage
Purchase Details
Closed on
May 10, 2004
Sold by
Pham Lam Phat D and Pham Lam Nghia
Bought by
Pham Lam Phat D and Pham Lam Nghia
Purchase Details
Closed on
Nov 26, 2003
Sold by
Domagas Marcelino S
Bought by
Pham Lam Phat D and Pham Lam Nghia
Purchase Details
Closed on
Nov 20, 2003
Sold by
Lam Lan To Huynh
Bought by
Lam David
Purchase Details
Closed on
Nov 14, 2001
Sold by
Domagas Segundina M
Bought by
Domagas Marcelino S
Create a Home Valuation Report for This Property
The Home Valuation Report is an in-depth analysis detailing your home's value as well as a comparison with similar homes in the area
Home Values in the Area
Average Home Value in this Area
Purchase History
We collect this data history from publicly available records. To have your information removed, we recommend requesting removal directly through your county’s website.
| Date | Buyer | Sale Price | Title Company |
|---|---|---|---|
| Kc Holdings Llc | $780,000 | Chicago Title Company | |
| Quach Alex | $110,000 | Chicago Title Company | |
| Lam David | -- | Chicago Title Company | |
| Pham Lam Phat D | -- | -- | |
| Pham Lam Phat D | -- | -- | |
| Pham Lam Phat D | $1,000 | Alliance Title Company | |
| Lam David | -- | Alliance Ttle Company | |
| Domagas Marcelino S | -- | -- |
Source: Public Records
Mortgage History
We collect this data history from publicly available records. To have your information removed, we recommend requesting removal directly through your county’s website.
| Date | Status | Borrower | Loan Amount |
|---|---|---|---|
| Previous Owner | Quach Alex | $80,000 |
Source: Public Records
Tax History
| Year | Tax Paid | Tax Assessment Tax Assessment Total Assessment is a certain percentage of the fair market value that is determined by local assessors to be the total taxable value of land and additions on the property. | Land | Improvement |
|---|---|---|---|---|
| 2025 | $13,301 | $887,491 | $266,247 | $621,244 |
| 2024 | $13,301 | $870,090 | $261,027 | $609,063 |
| 2023 | $13,971 | $853,030 | $255,909 | $597,121 |
| 2022 | $13,564 | $836,307 | $250,892 | $585,415 |
| 2021 | $12,970 | $819,911 | $245,973 | $573,938 |
| 2020 | $12,828 | $811,511 | $243,453 | $568,058 |
| 2019 | $12,346 | $795,600 | $238,680 | $556,920 |
| 2018 | $6,494 | $402,444 | $114,444 | $288,000 |
| 2017 | $2,368 | $112,200 | $112,200 | $0 |
| 2016 | $1,457 | $54,849 | $54,849 | $0 |
| 2015 | $1,448 | $54,025 | $54,025 | $0 |
| 2014 | $1,348 | $52,967 | $52,967 | $0 |
Source: Public Records
Map
Nearby Homes
- 1545 23rd Ave
- 1547 23rd Ave
- 1526 Munson Way
- 2503 E 16th St
- 2540 E 16th St Unit 2
- 2538 E 16th St Unit 1
- 2555 Foothill Blvd
- 1757 26th Ave
- 2560 International Blvd
- 2322 E 21st St
- 2207 E 21st St
- 2116 International Blvd
- 2624 Foothill Blvd
- 1290 26th Ave
- 2618 E 20th St
- 2036 E 20th St
- 2017 27th Ave
- 2021 27th Ave
- 2004 27th Ave
- 2222 Inyo Ave
- 1634 23rd Ave
- 1638 23rd Ave
- 1632 23rd Ave
- 2308 Foothill Blvd
- 2312 Foothill Blvd
- 2300 Foothill Blvd
- 2324 Foothill Blvd
- 2327 E 17th St
- 2332 Foothill Blvd
- 2331 E 17th St
- 2338 Foothill Blvd
- 2339 E 17th St
- 1704 23rd Ave
- 2348 Foothill Blvd
- 2318 E 17th St
- 2347 E 17th St
- 2352 Foothill Blvd
- 1716 23rd Ave
- 1607 Miller Ave
- 2328 E 17th St
Your Personal Tour Guide
Ask me questions while you tour the home.