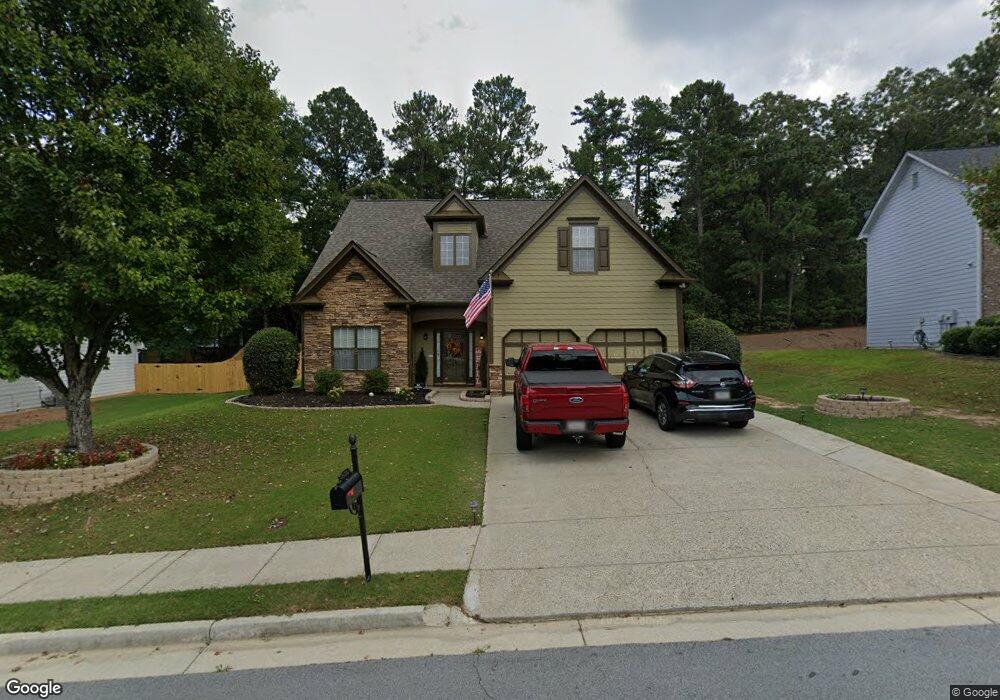
2361 Kelman Place Dacula, GA 30019
Estimated Value: $404,000 - $416,000
5
Beds
3
Baths
2,364
Sq Ft
$173/Sq Ft
Est. Value
About This Home
This home is located at 2361 Kelman Place, Dacula, GA 30019 and is currently estimated at $408,292, approximately $172 per square foot. 2361 Kelman Place is a home located in Gwinnett County with nearby schools including Dacula Elementary School, Dacula Middle School, and Dacula High School.
Ownership History
Date
Name
Owned For
Owner Type
Purchase Details
Closed on
Jan 19, 2018
Sold by
Greater Metro Investment G
Bought by
Teiusanu Silviu and Teiusanu Mihaela Maria
Current Estimated Value
Home Financials for this Owner
Home Financials are based on the most recent Mortgage that was taken out on this home.
Original Mortgage
$208,416
Outstanding Balance
$175,468
Interest Rate
3.94%
Mortgage Type
New Conventional
Estimated Equity
$232,824
Purchase Details
Closed on
Jan 30, 2017
Bought by
Greater Metro Investment Grp L
Purchase Details
Closed on
Nov 1, 2016
Sold by
Pablo M
Bought by
Us Bank National Association T
Purchase Details
Closed on
Mar 31, 2003
Sold by
Richport Properties Inc
Bought by
Cortes Pablo M and Cortes Kristy
Home Financials for this Owner
Home Financials are based on the most recent Mortgage that was taken out on this home.
Original Mortgage
$179,200
Interest Rate
5.6%
Mortgage Type
FHA
Create a Home Valuation Report for This Property
The Home Valuation Report is an in-depth analysis detailing your home's value as well as a comparison with similar homes in the area
Home Values in the Area
Average Home Value in this Area
Purchase History
| Date | Buyer | Sale Price | Title Company |
|---|---|---|---|
| Teiusanu Silviu | $215,000 | -- | |
| Greater Metro Investment Grp L | $196,000 | -- | |
| Us Bank National Association T | $187,000 | -- | |
| Cortes Pablo M | $182,300 | -- |
Source: Public Records
Mortgage History
| Date | Status | Borrower | Loan Amount |
|---|---|---|---|
| Open | Teiusanu Silviu | $208,416 | |
| Previous Owner | Cortes Pablo M | $179,200 |
Source: Public Records
Tax History Compared to Growth
Tax History
| Year | Tax Paid | Tax Assessment Tax Assessment Total Assessment is a certain percentage of the fair market value that is determined by local assessors to be the total taxable value of land and additions on the property. | Land | Improvement |
|---|---|---|---|---|
| 2025 | $4,496 | $160,360 | $30,000 | $130,360 |
| 2024 | $4,439 | $150,880 | $36,000 | $114,880 |
| 2023 | $4,439 | $149,880 | $36,000 | $113,880 |
| 2022 | $4,044 | $133,600 | $29,600 | $104,000 |
| 2021 | $3,467 | $103,320 | $23,600 | $79,720 |
| 2020 | $3,345 | $96,600 | $23,600 | $73,000 |
| 2019 | $2,993 | $85,040 | $19,200 | $65,840 |
| 2018 | $3,060 | $78,400 | $19,200 | $59,200 |
| 2016 | $2,595 | $70,520 | $16,000 | $54,520 |
| 2015 | $2,621 | $70,520 | $16,000 | $54,520 |
| 2014 | $2,477 | $66,120 | $12,800 | $53,320 |
Source: Public Records
Map
Nearby Homes
- 535 Maeve Ln
- 2768 Ballyshannon Ct
- 2015 Waycross Ln
- 2304 Pelham Pass
- 2407 Pelham Pass
- 2693 Austin Ridge Dr
- 2819 Heritage Oaks Cir Unit 7
- 2647 Stockbridge Way
- 2827 Riders Ct
- 2879 Heritage Oaks Cir
- 2793 Austin Ridge Dr
- 2818 Stockbridge Way
- 2592 Freemans Walk Path
- 2896 Spence Ct
- 2800 Araglin Dr
- 3189 Eastham Run Dr
- 929 Hilltop Park Ct
- 2623 Carleton Gold Rd
- 67 Creek Side Place
- 2361 Kelman Place Unit 5
- 2351 Kelman Place
- 2371 Kelman Place
- 2341 Kelman Place
- 2381 Kelman Place
- 2331 Kelman Place
- 0 Kelman Place NE Unit 7004123
- 0 Kelman Place NE
- 2382 Kelman Place Unit 1
- 2342 Kelman Place
- 2391 Kelman Place Unit 1
- 180 Carleton Gold Trail
- 2321 Kelman Place Unit 1
- 2392 Kelman Place
- 2332 Kelman Place Unit 1
- 312 Penwood Trail
- 2401 Kelman Place
- 313 Penwood Trail Unit 1
- 190 Carleton Gold Trail
- 2402 Kelman Place